On 17 March 2018, National Parks Board (NParks) launched a new portal site, Trees.sg, dedicated to trees in Singapore. It's featured on Mothership.sg and The Straits Times, and tweeted by the Prime Minister. The map took 10 months to create at a cost of $100,000. It has a record of 500,000 trees and was billed as the most extensive tree map in Asia.
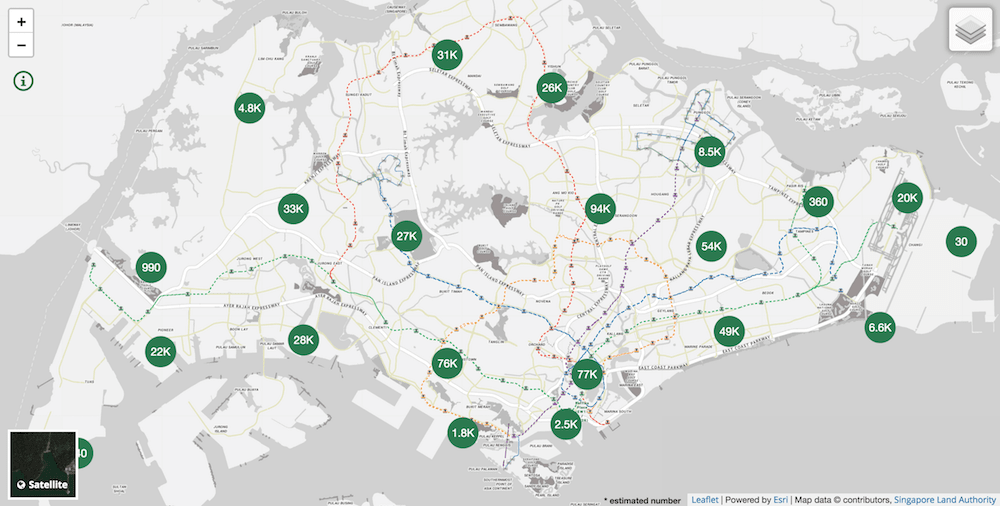
On 18 March 2018, I successfully scraped all the trees data from the site, which is roughly 600MB in file size. According to the data, there's a total of 564,266 recorded trees. I was super psyched to see how I could visualize the data to my heart's content.
Acquiring the data
Opening the Chrome Developer Tools, via the 'Network' tab, the initial requests for the map data look like this:
https://imaven.nparks.gov.sg/arcgis/rest/services/maven/PTM_View_Grid/FeatureServer/1/query?…
It seems to return clusters of the trees, which is not exactly what I want. As the map is zoomed in, individual trees start to appear.
The request endpoint changed to this:
https://imaven.nparks.gov.sg/arcgis/rest/services/maven/PTMap/FeatureServer/2/query?returnGeometry=true&where=1%3D1&outSr=4326&outFields=*&inSr=4326&geometry=%7B%22xmin%22%3A103.8482666015625%2C%22ymin%22%3A1.2935302390231982%2C%22xmax%22%3A103.85101318359375%2C%22ymax%22%3A1.2962761196418218%2C%22spatialReference%22%3A%7B%22wkid%22%3A4326%7D%7D&geometryType=esriGeometryEnvelope&spatialRel=esriSpatialRelIntersects&geometryPrecision=6&f=geojson
One particular query string that caught my eye is geometry which contains a value that looks like an encoded JSON string. Once the string is decoded, it looks like this:
{
  "xmin": 103.8482666015625,
  "ymin": 1.2935302390231982,
  "xmax": 103.85101318359375,
  "ymax": 1.2962761196418218,
  "spatialReference": { "wkid":4326 }
}
Judging from the API URL address, I suspect it runs on ArcGIS to serve the data based on tile boundaries or something. I'm not very familiar with ArcGIS so I experimented with the REST API calls by modifying the queries. My first attempt was to put the whole Singapore boundary into the xmin, ymin, xmax and ymax values, but it returned an error probably due to response being too large and it timed out 😅
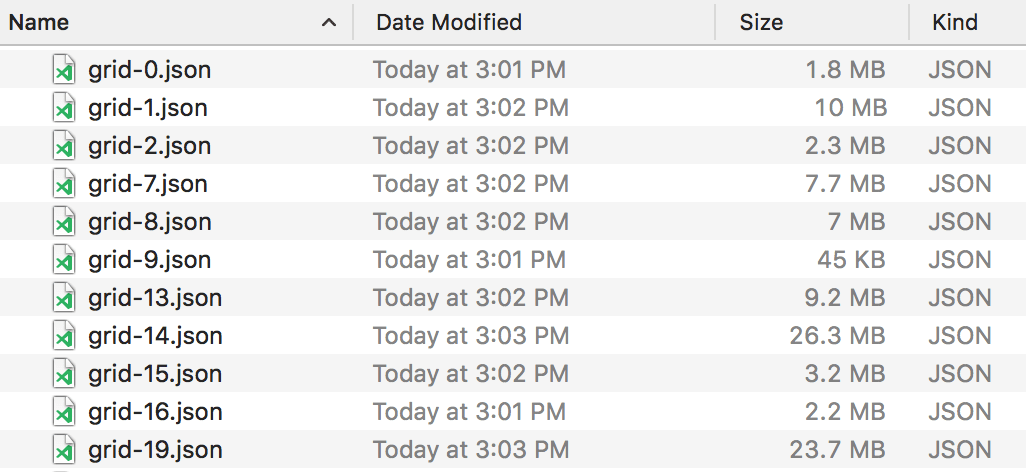
I was thinking, I probably would need to chop the whole Singapore boundary into multiple smaller boundaries and make an API request for every boundary. Judging from the vastness of Singapore and the zoom levels, I roughly guessed that it would be quite a lot of API requests and that sounds troublesome 😅
So… I gave up.
Yeap.
Nope. 😉 I needed something like a grid. Something that can auto-generate multiple boundaries from a single large boundary. I've been using Turf.js a lot in my previous projects, so I looked around and found squareGrid. The example code looks like this:
var bbox = [-95, 30 ,-85, 40];
var cellSide = 50;
var options = {units: 'miles'};

var squareGrid = turf.squareGrid(bbox, cellSide, options);
This code creates a square grid from a bounding box, bbox, with each cell having the side length of 50 miles (cellSide). According to Wikipedia, the mainland of Singapore measures 50 kilometres (31 miles) from east to west. If I want a grid of 10 cells horizontally, I guess I'll have to specify a cell side of 5 km. I tried it out with a rough boundary of Singapore and… it kind of worked. 😯
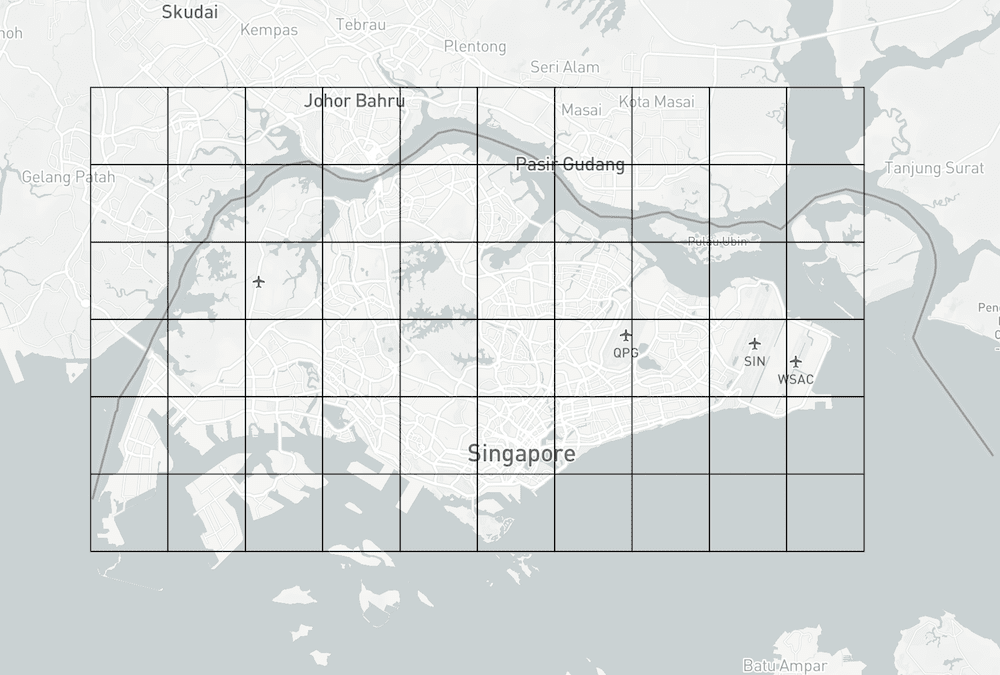
I might have missed the other parts of Singapore but fortunately, there are no recorded trees over there yet. 😌
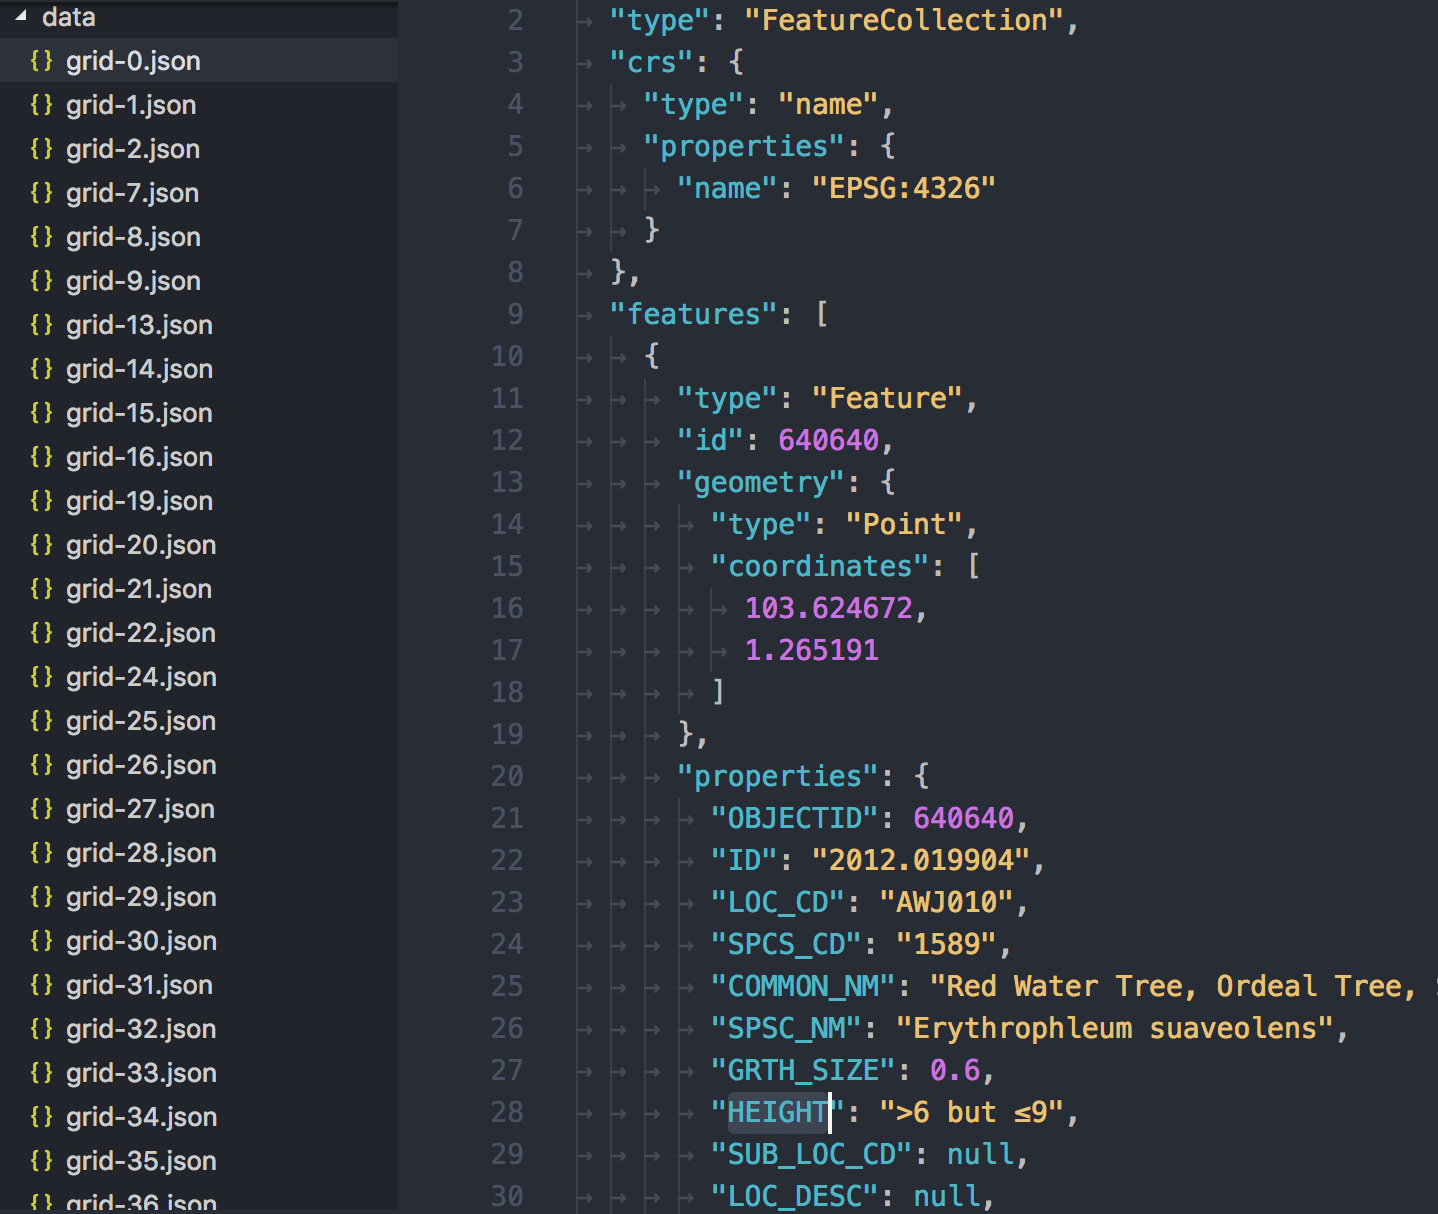
I wrote a script to fetch the API responses for every boundary, and boom, I got all the data! 🤩🤩🤩
Visualizing the trees
I looked at Trees.sg and wondered how I could do it differently. The data contains quite a few interesting information about the trees such as the girth size (meters), height (meters), age (years), species and type.
I find that the height information is quite odd because the value is stored like this: >6 but ≤9 (interpreted as: more than 6 but less or equal to 9 meters). The but value is quite hilarious in my opinion 😆. I'm not an expert in this field, so pardon my amateur reaction as I realise that tree measurements can be so complicated!
My first attempt was to push the limits as much as possible by drawing all the trees on a map in 3D. 💥💥💥
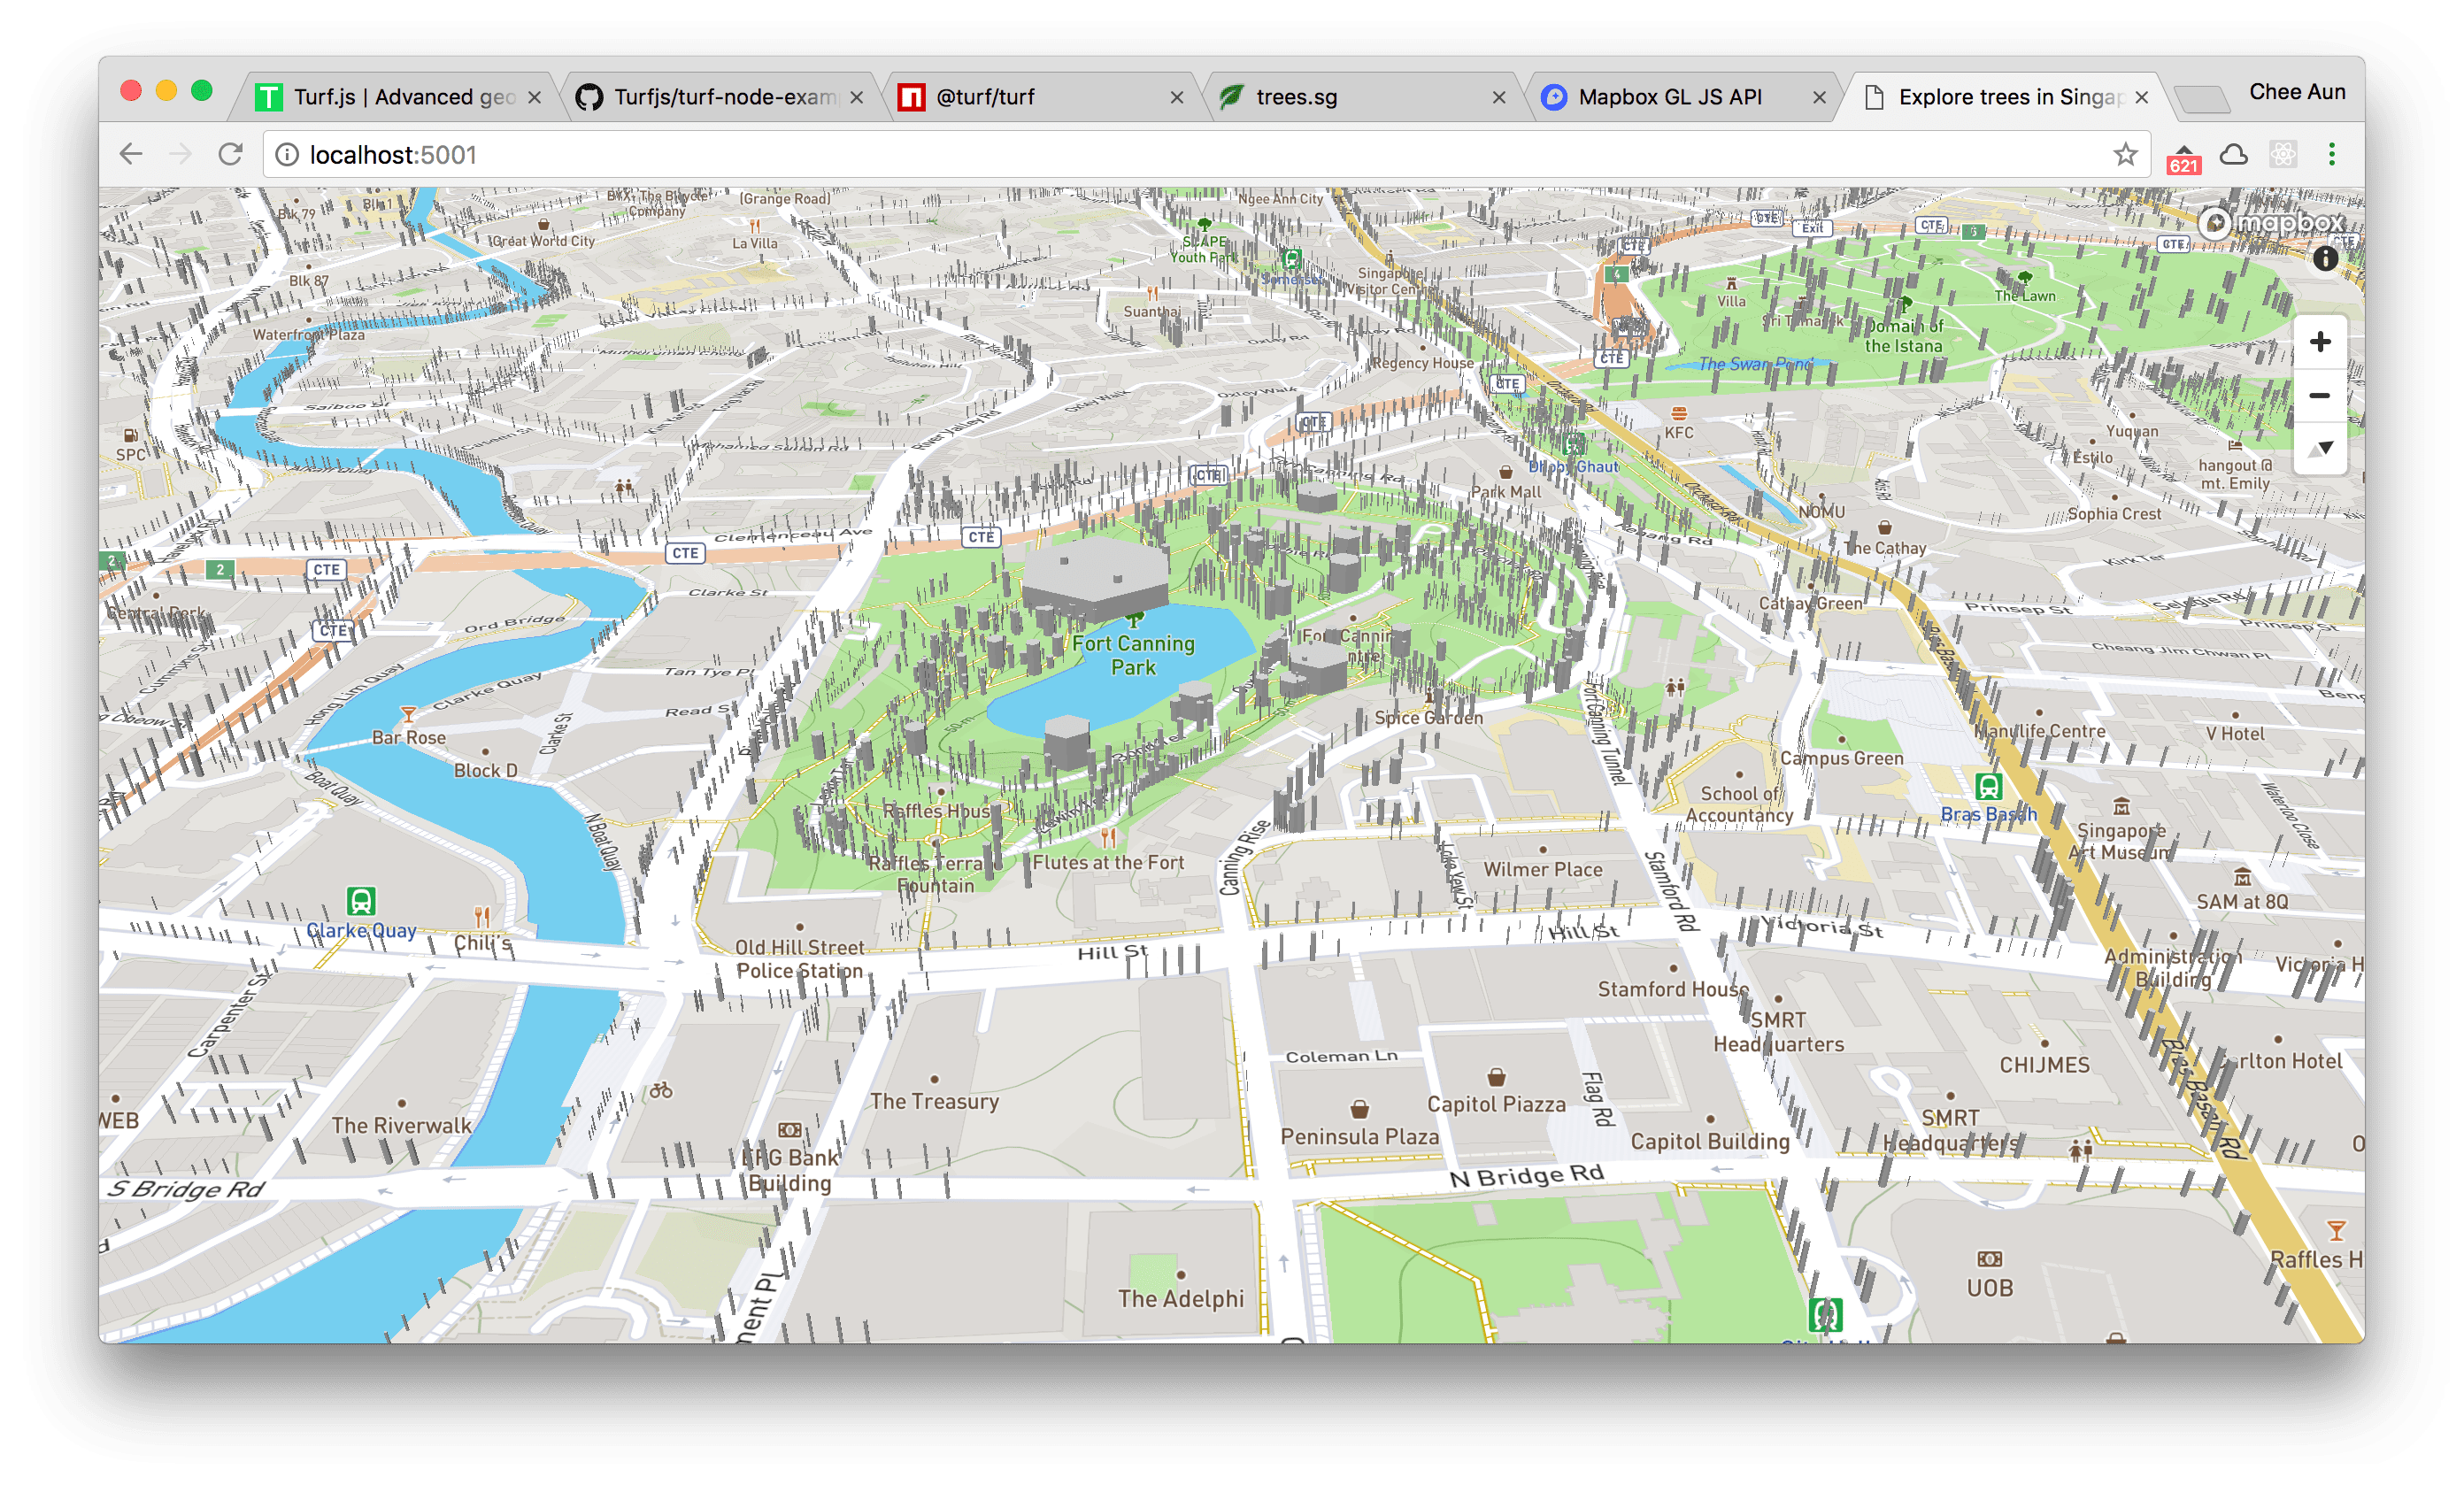
I have no idea why some of the trees overlap one another. Probably I miscalculated the tree radius from the girth size or something. 🤷♂️
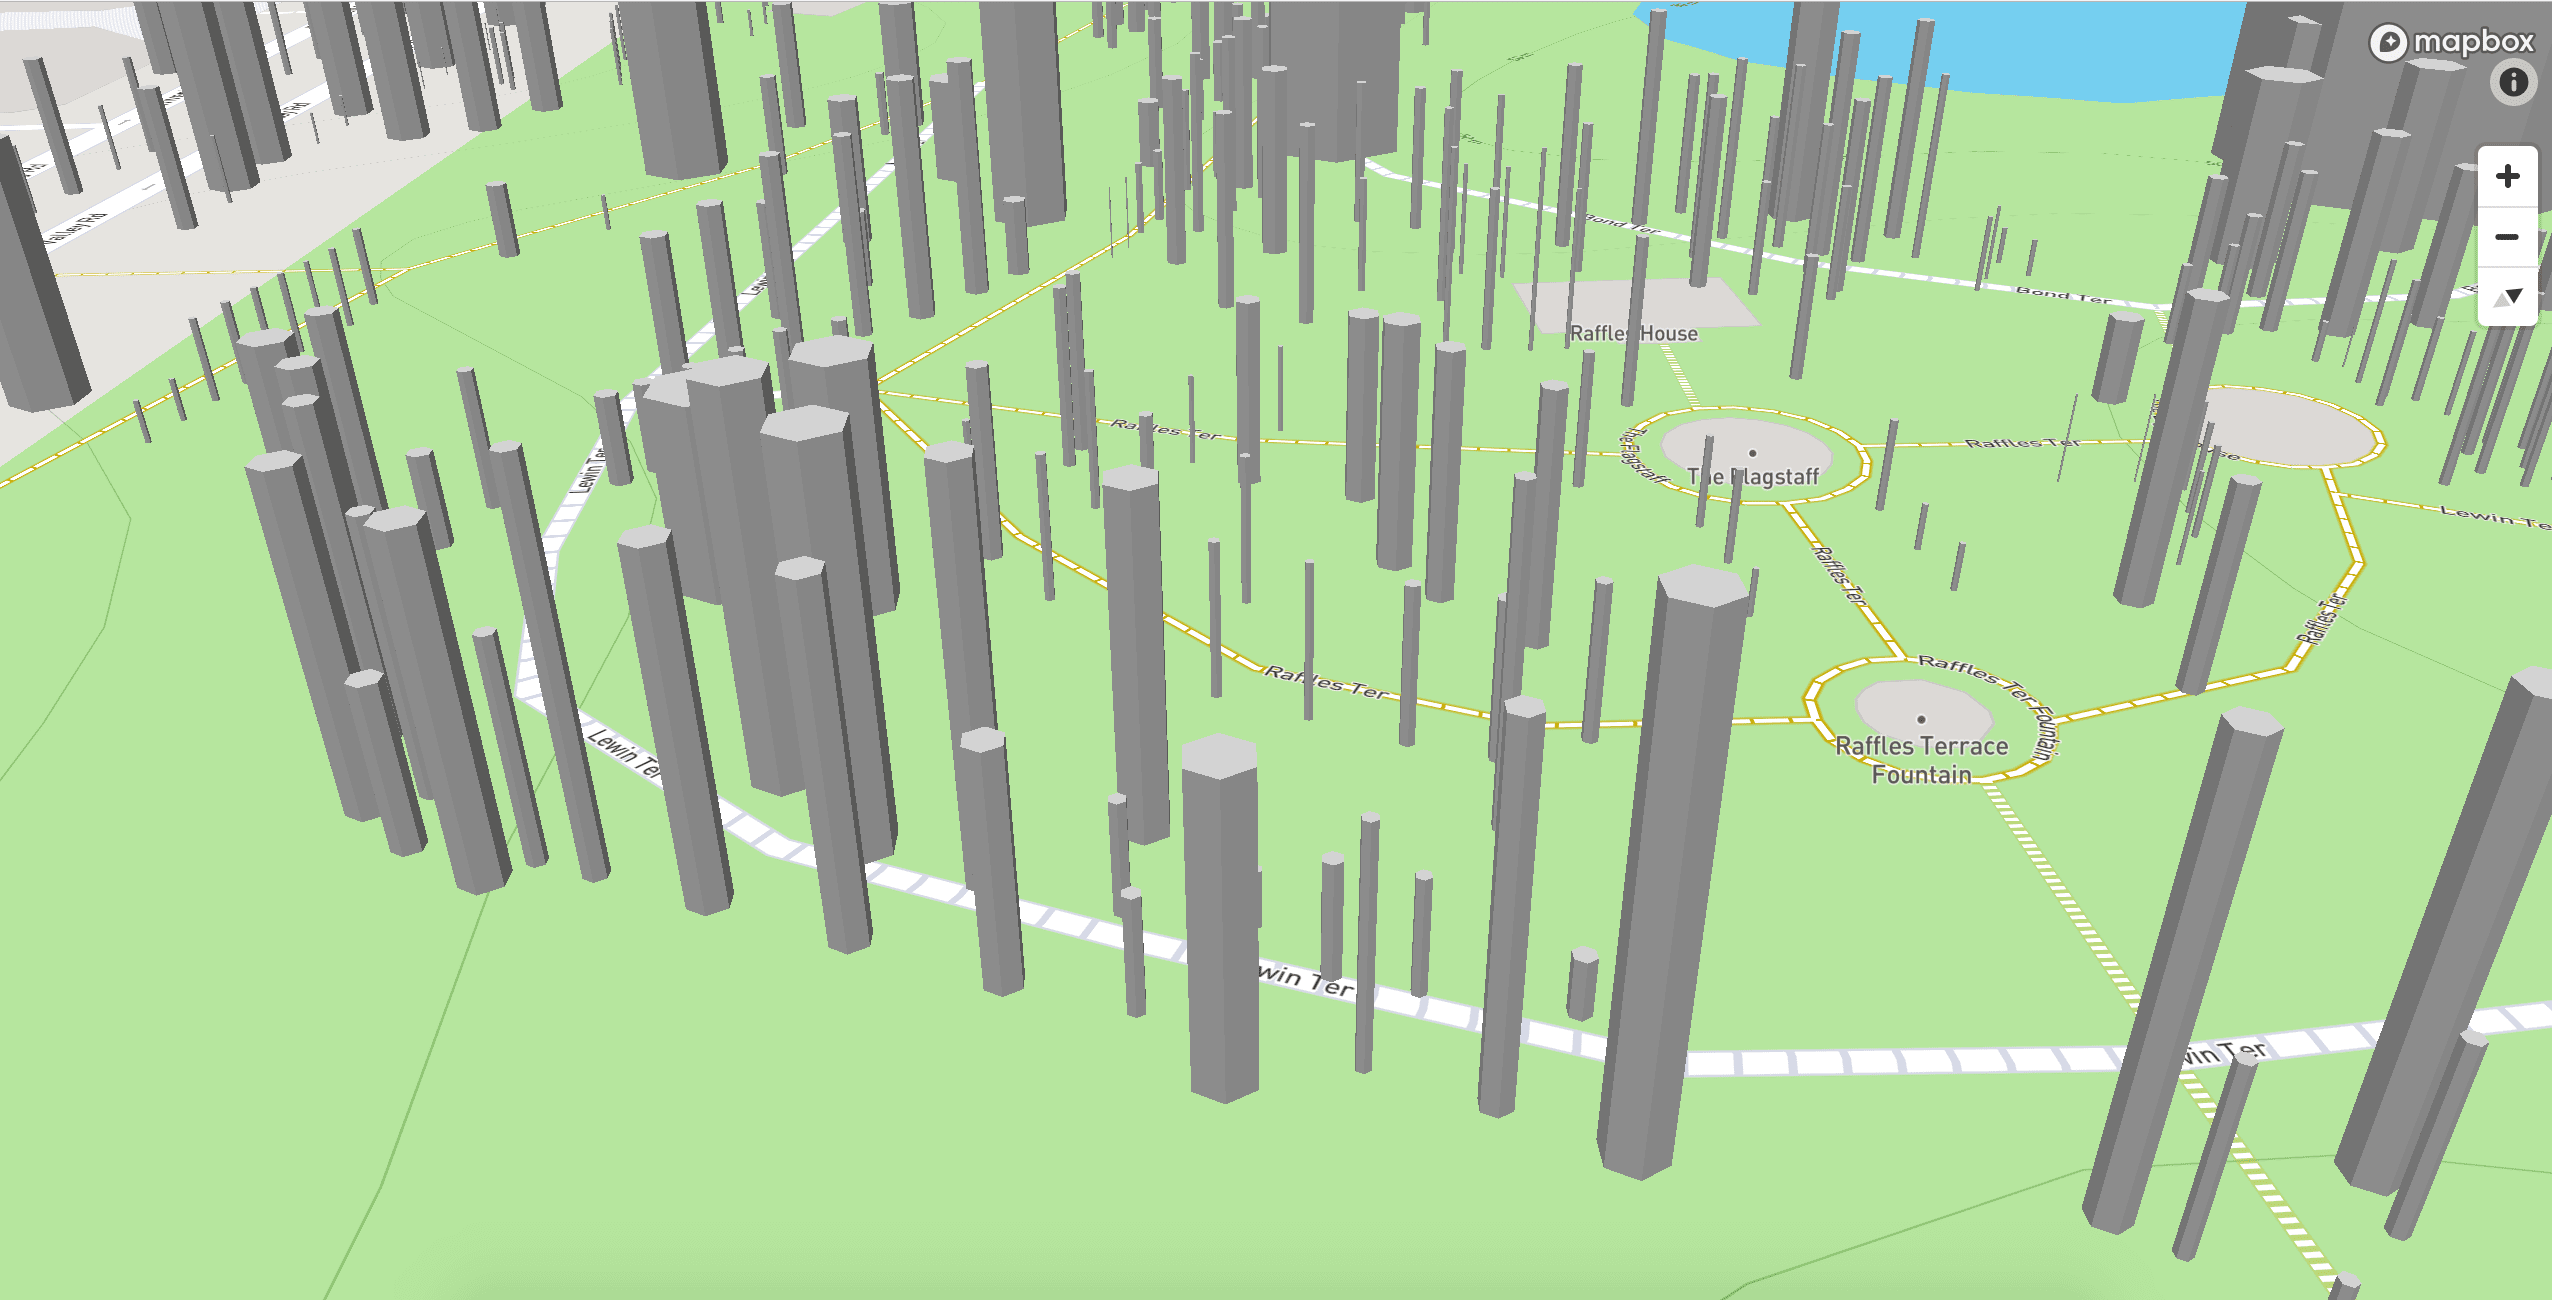
Here's a close-up:
The code, simplified:
const radius = GRTH_SIZE/(Math.PI*2);

const circle = turf.circle(center, radius/1000, {
  steps: 6,
  properties: {
    height: parseInt((HEIGHT.match(/(\d+)[^\d]*$/) || [,0])[1], 10),
  },
});
I use Turf.circle to generate circle polygons with a radius calculated from the girth (GRTH_SIZE). The steps property is set to 6 instead of the default 64 for performance reasons, which explains why the tree 3D models look hexagonal (6 sides).
Since the height is a ranged value (between two values), I use a regular expression to pick the last number in the string. If the HEIGHT value is >6 but ≤9, the tree height will be 9 meters.
By using Mapbox GL JS and its 3D features, I manage to render the extruded polygons with both the girth and height values. However, the map was too embarrassingly slow. Unlike buildings and skyscrapers, the trees were smaller and needed higher zoom levels. Without 3D terrain elevation data and tree crown spread data, it doesn't seem realistic or useful enough in my opinion.
It may look super cool and can be done, but it doesn't mean that it should be.
So… I gave up.
Yeap.
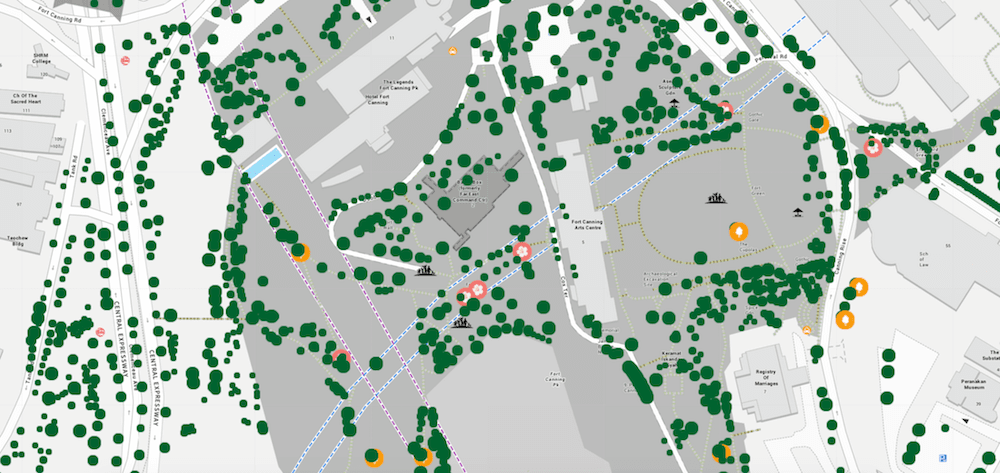
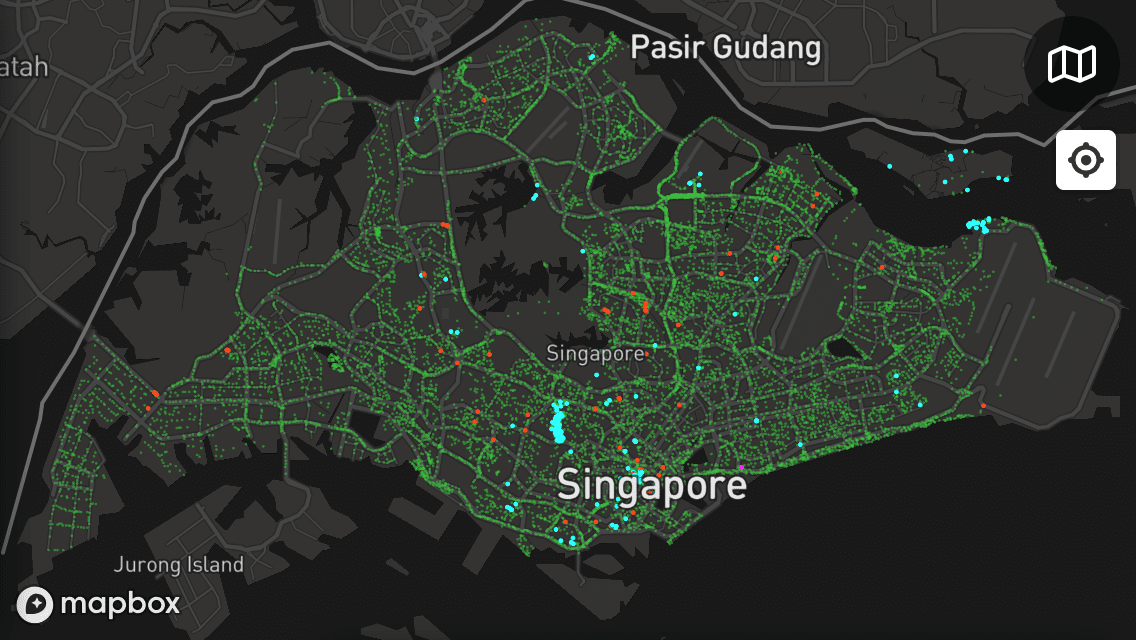
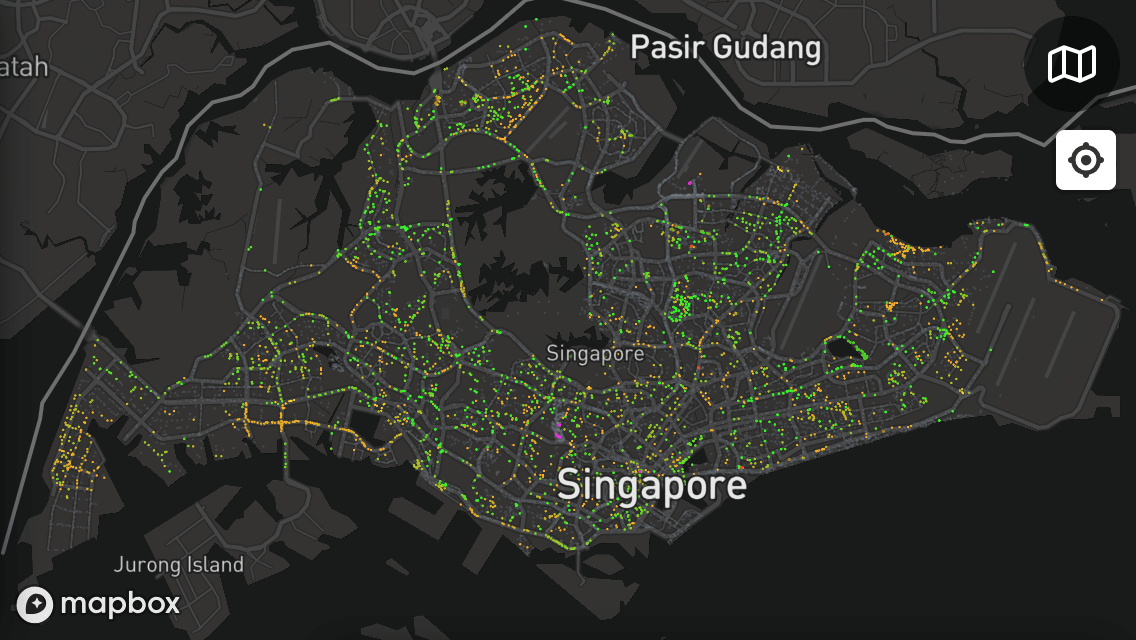
Nope. 😂 I downgraded it to a simple 2D version. I personally find it quite difficult to gauge the density of the recorded trees in Trees.sg due to the clusters.
I want to see all trees in the whole of Singapore without clusters.
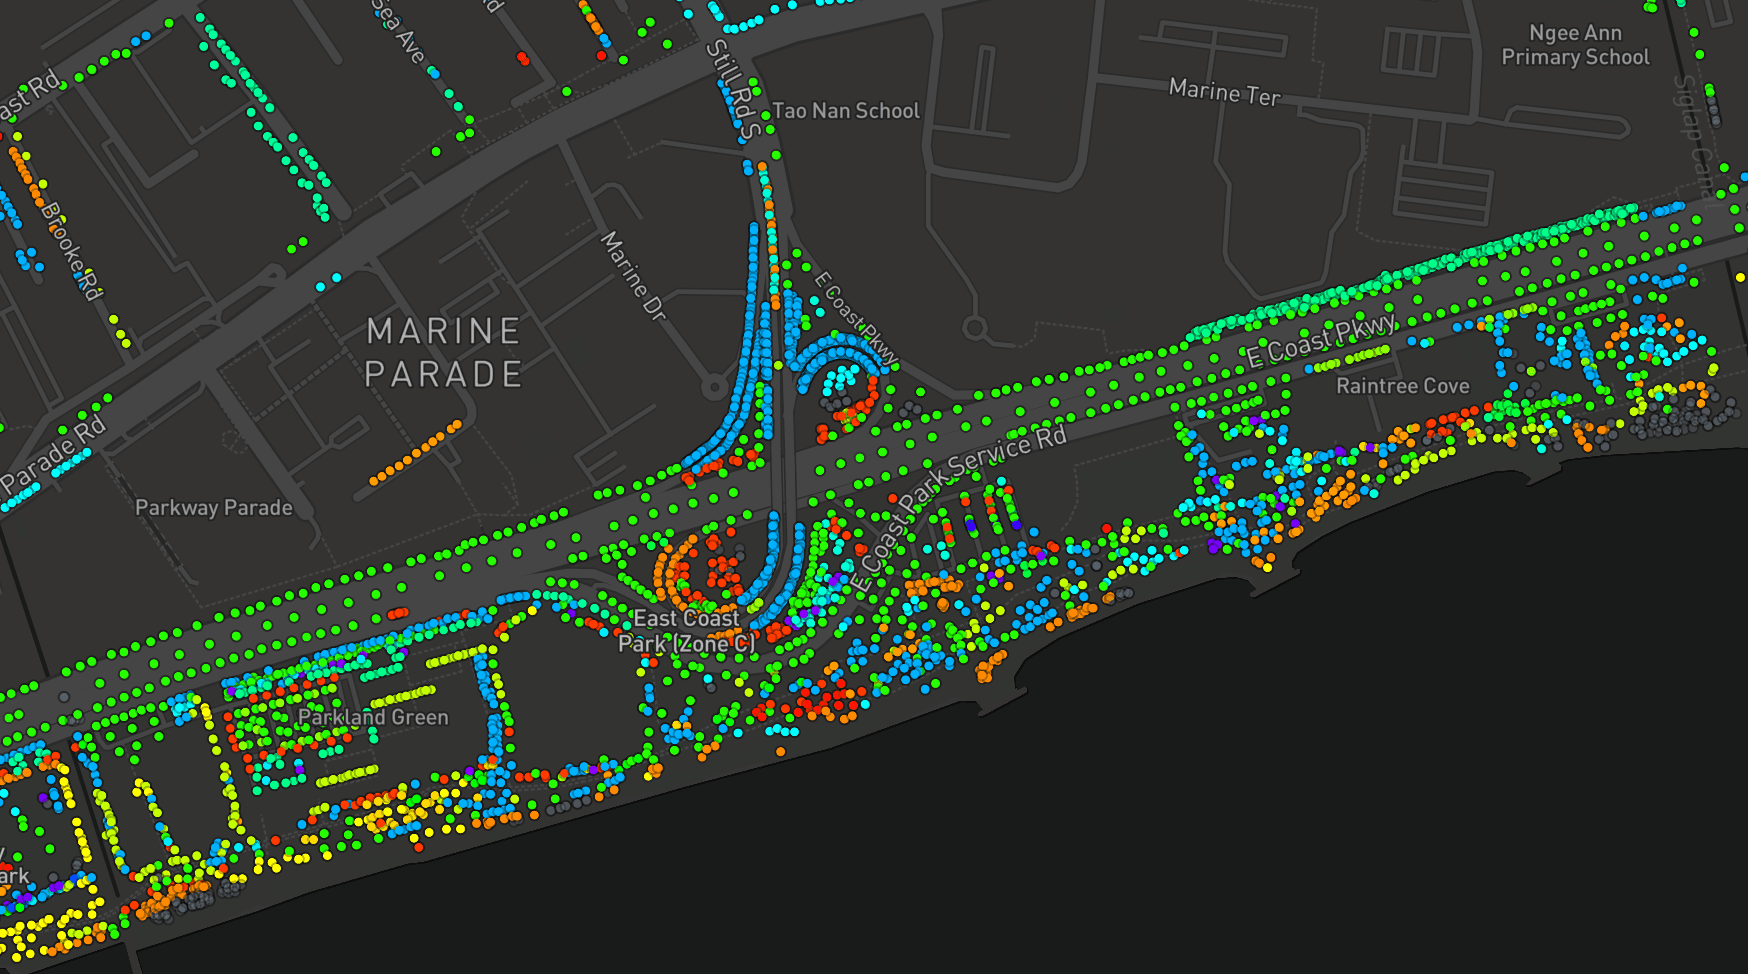
Similar to Trees.sg, the circle markers also have different sizes based on their girth widths.
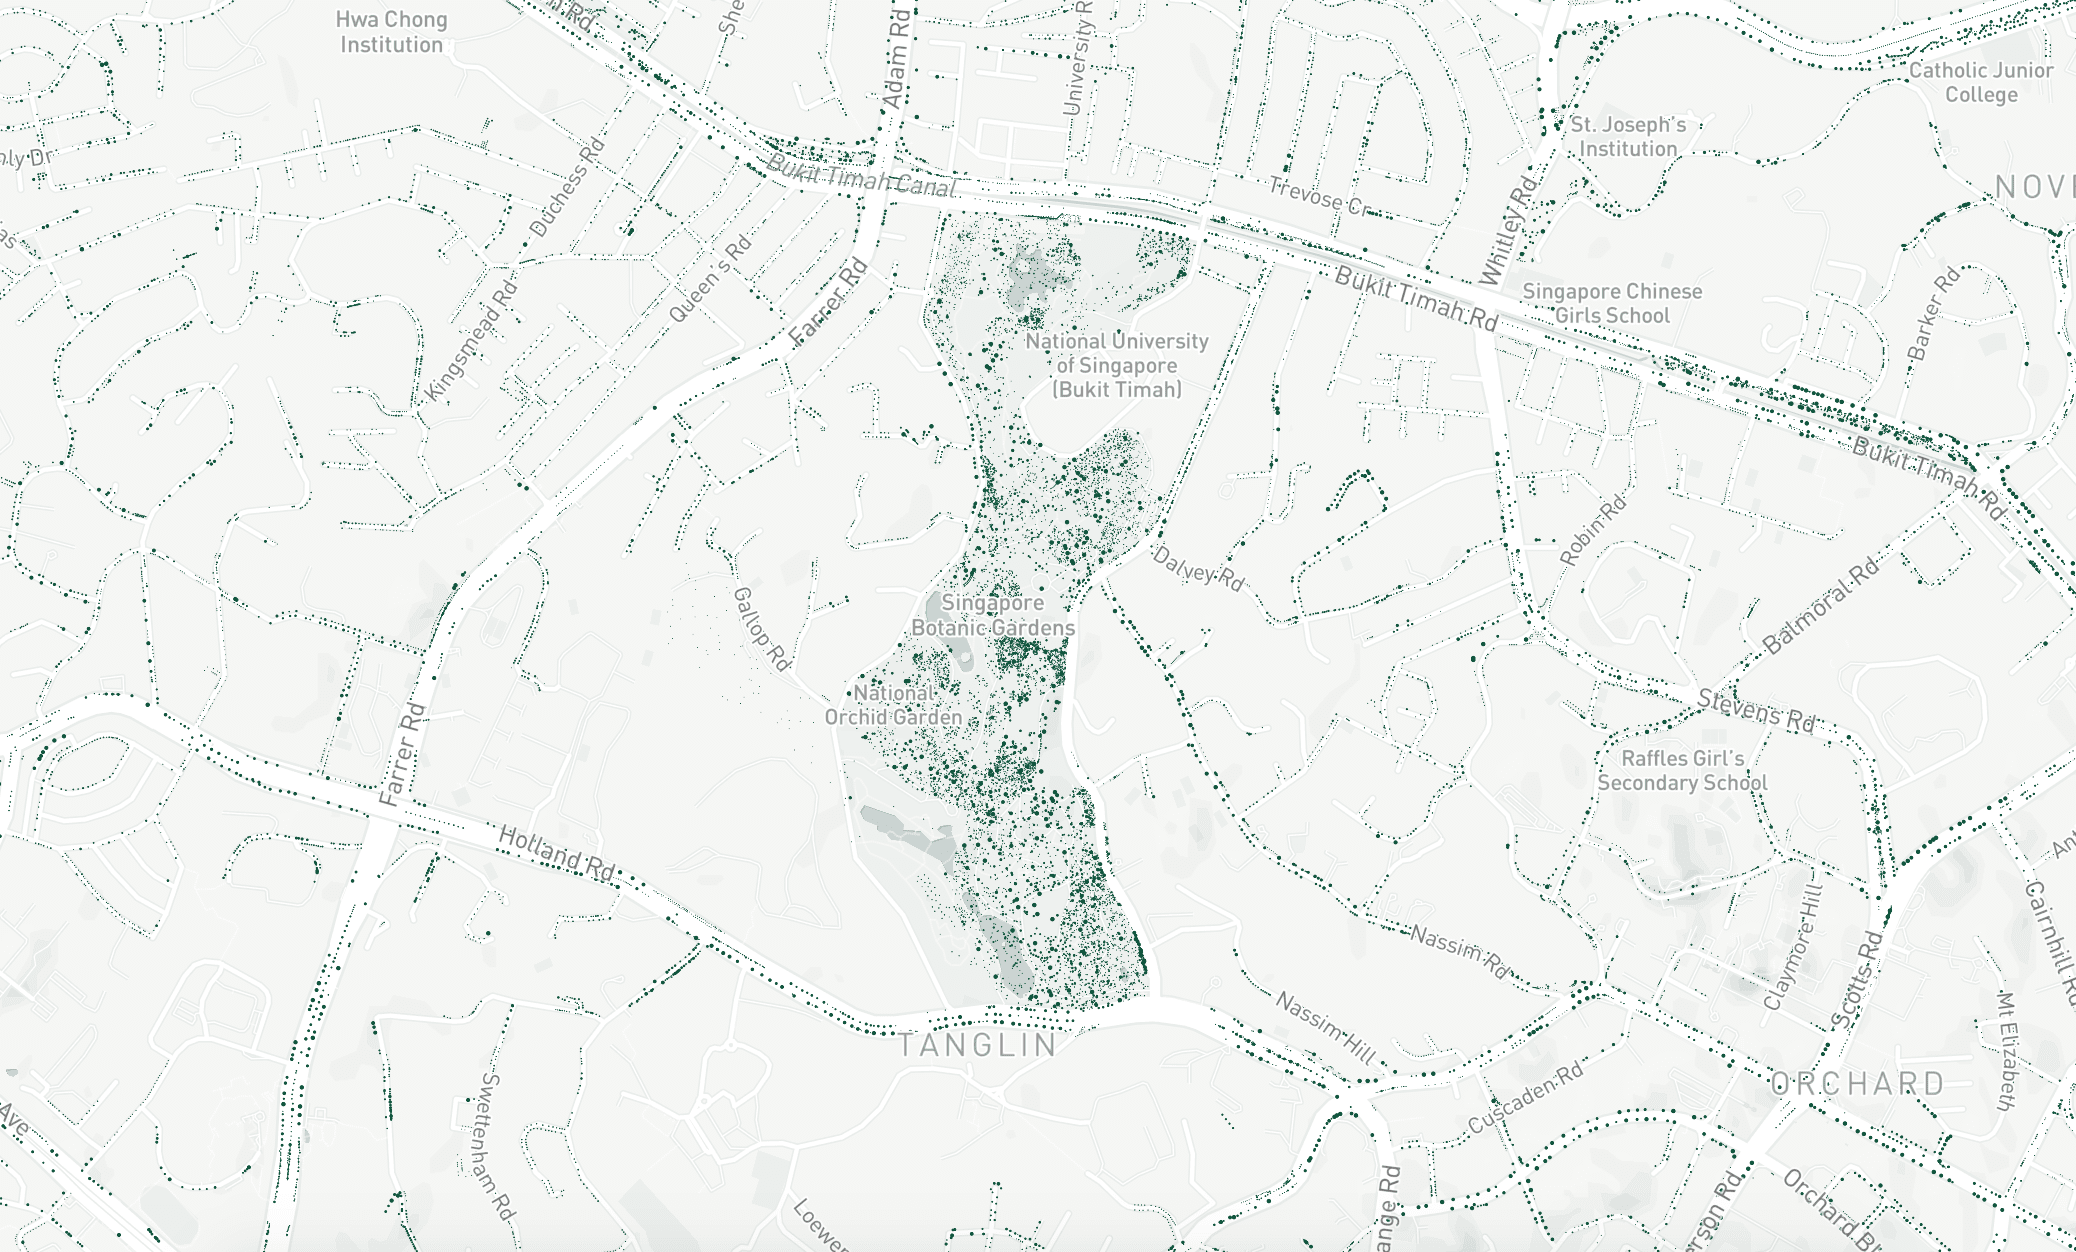
Even though I manage to make this work, the map is still kind of slow when panning and zooming around. 😭
Deep diving into the data
I researched on Google and found this article on Working with large GeoJSON sources in Mapbox GL JS. There's the 'Even bigger data' section that states:
If your source data starts to get really large (over 500,000 data points), there are a couple other techniques you can use to improve speed.
So it seems that 500,000 is like a magic number when performance issues will start happening for Mapbox GL JS. And yes, coincidentally there are more than 500,000 data points for the trees 😏.
The first technique is called 'Source splitting', which is to break up the GeoJSON sources so that I can double or triple the ability for data loading and rendering. I tried it but it still doesn't feel significantly faster, especially on a mobile. 😔
The second technique is to use Tippecanoe, which I end up using for ExploreTrees.SG. With Tippecanoe, I generate vector tilesets in MBTiles format from the large GeoJSON files, upload it to Mapbox Studio, and load it on the web with Mapbox GL JS.
Sounds easy? Nope. I spent more than 10 days massaging the data, deduplicating trees that seem to be the same(?), interpreting the tree types that are not consistent at all and playing around with various options in Tippecanoe.
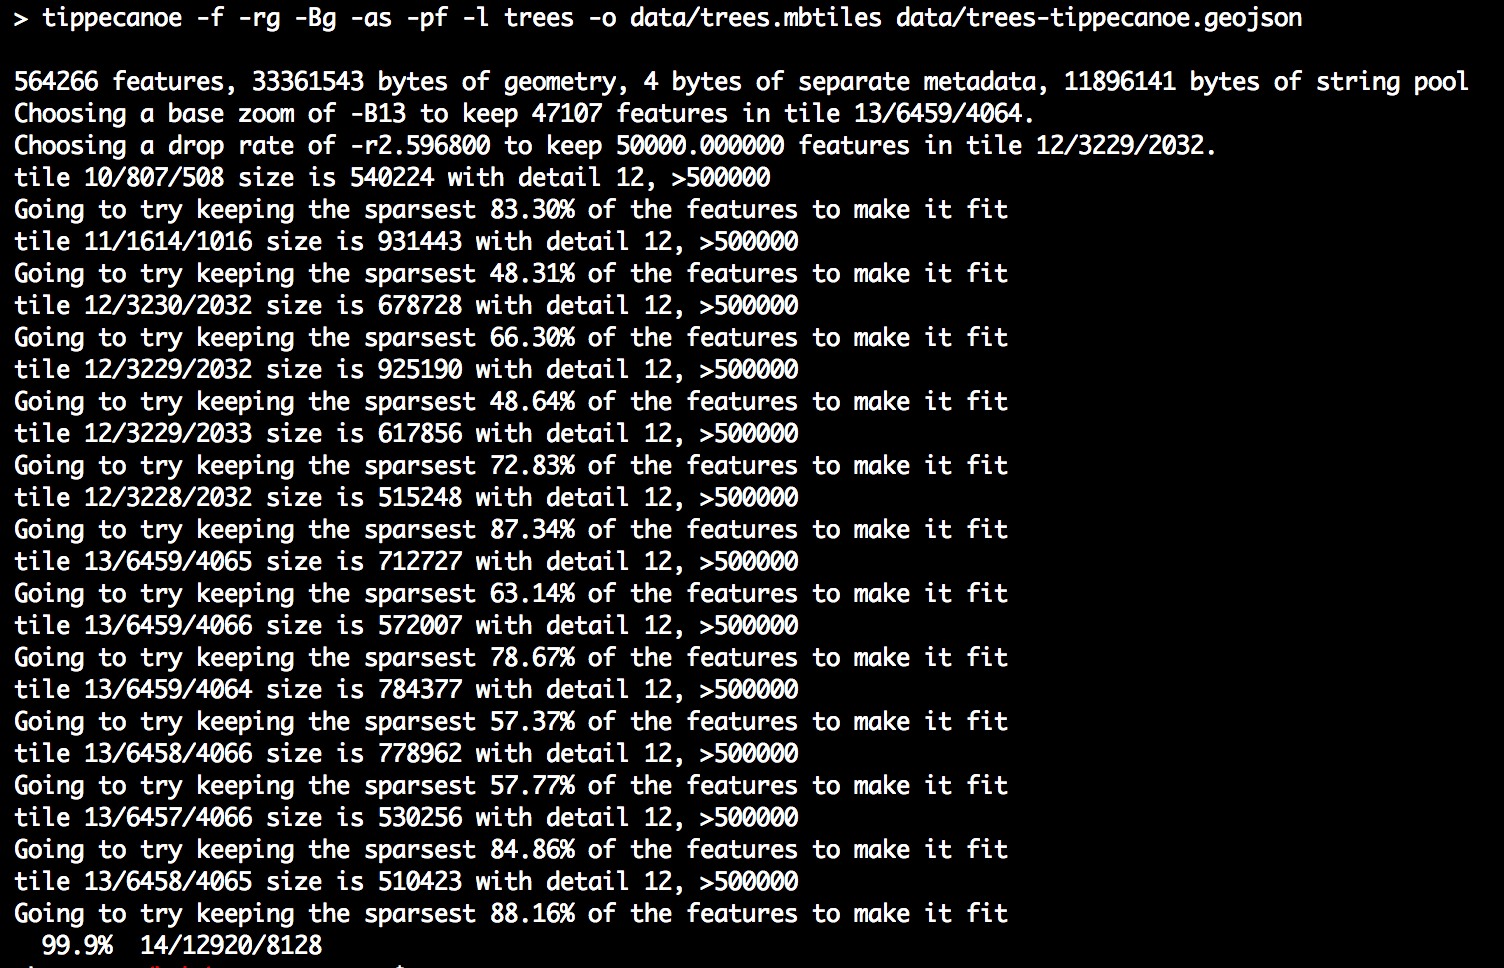
At lower zoom levels, Tippecanoe will drop or coalesce a fraction of features (data points) by setting some limits on the number of features and tile sizes. It's almost like the same concept as clustering but with more control and the "clusters" are much smaller and more geographically detailed.
As how Tippecanoe described its intent:
If you give it all the building footprints in Los Angeles and zoom out far enough that most individual buildings are no longer discernable, you should still be able to see the extent and variety of development in every neighborhood, not just the largest downtown buildings.
During my trials and errors in generating the vector tiles, I find it difficult to preserve certain data points. There are two special type of trees that are highlighted on Trees.sg; heritage trees and flowering trees. In a way, I want to prioritize these trees and make sure they always appear in any zoom levels.
Tippecanoe defines a GeoJSON extension that can enforce the appearance of the features. Here's an example:
{
    "type" : "Feature",
    "tippecanoe" : { "maxzoom" : 9, "minzoom" : 4 },
    "properties" : { "FULLNAME" : "N Vasco Rd" },
    "geometry" : {
        "type" : "LineString",
        "coordinates" : [ [ -121.733350, 37.767671 ], [ -121.733600, 37.767483 ], [ -121.733131, 37.766952 ] ]
    }
}
This LineString feature will be preserved from zoom level 4 until zoom level 9, stated in the tippecanoe property.
However, when I try this out, the important features are still being dropped at some zoom levels, which I generally don't quite understand. I might be running this incorrectly and finally I decided to use the solution mentioned in one of the GitHub issues. The solution is to split the data into two GeoJSON files, separating the important trees and other trees, generate two vector tiles and join them back again with tile-join.
The commands:
$ tippecanoe -f -r1 -l trees -o data/trees-important.mbtiles data/trees-important.geojson
$ tippecanoe -f -r2 -Bg -as -ae -l trees -o data/trees-other.mbtiles data/trees-other.geojson
$ tile-join -f -o data/trees.mbtiles data/trees-other.mbtiles data/trees-important.mbtiles
Note that -r1 option is used for important trees to preserve all of them without point dropping.
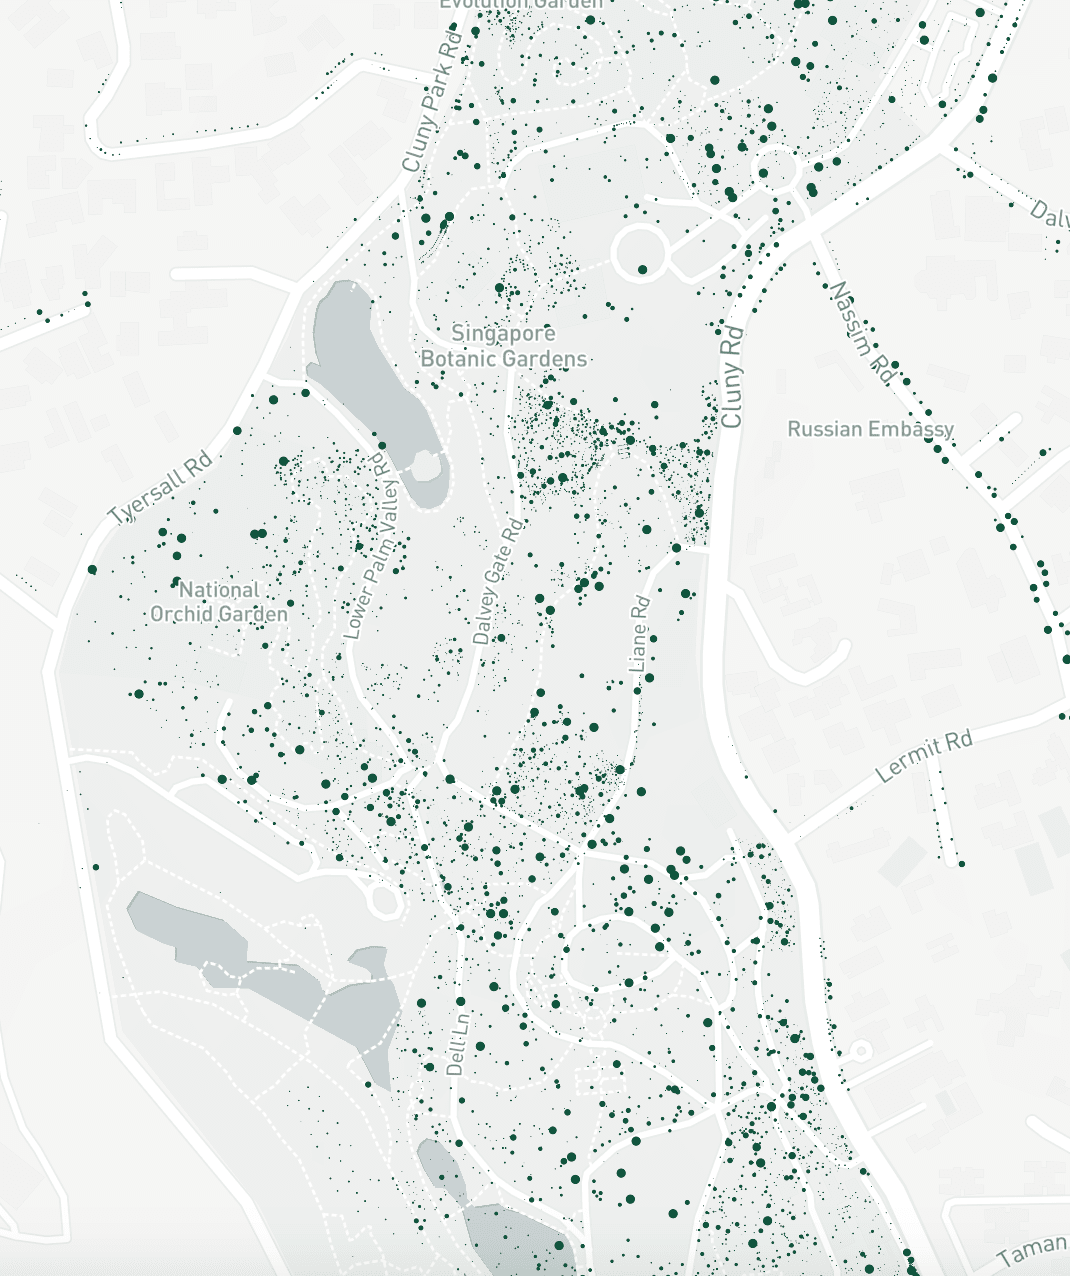
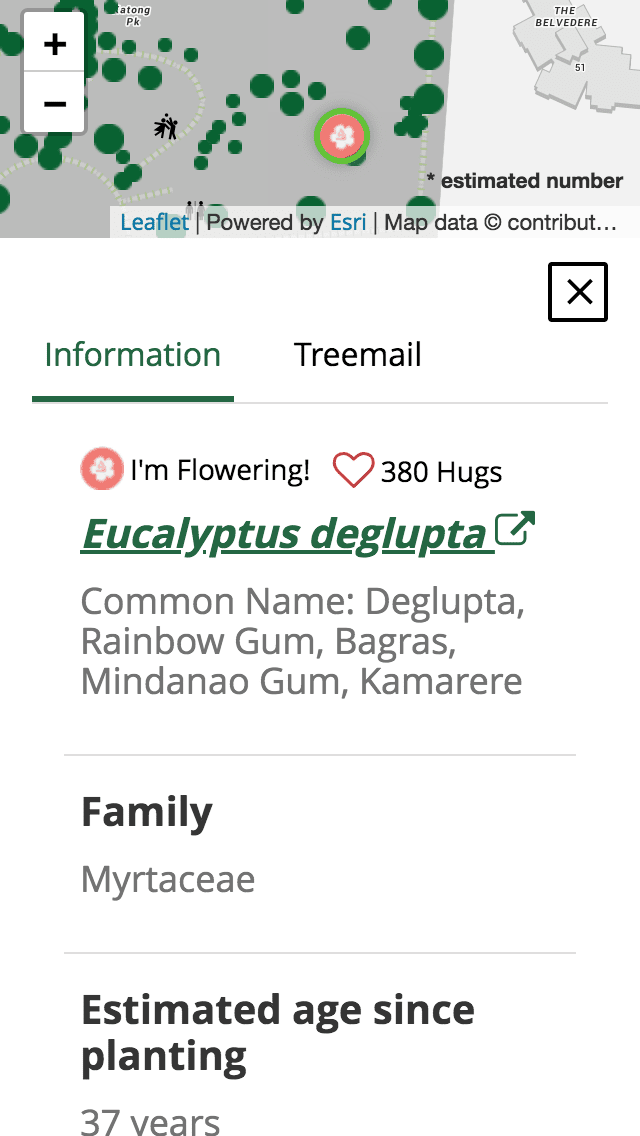
As a result, it becomes super easy to spot the heritage and flowering trees! Instead of realistically marking all markers as green, they are applied with distinct colors to make them stand out on lower zoom levels (lime for heritage trees, red for flowering trees).
I even styled them with bigger radii to make sure they're more visible.
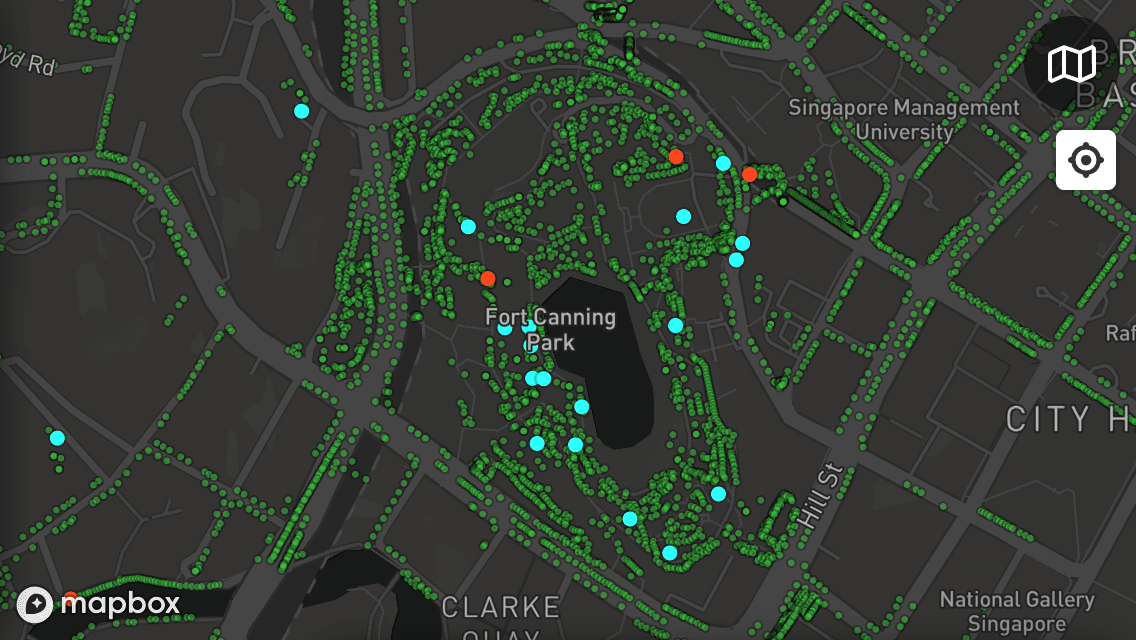
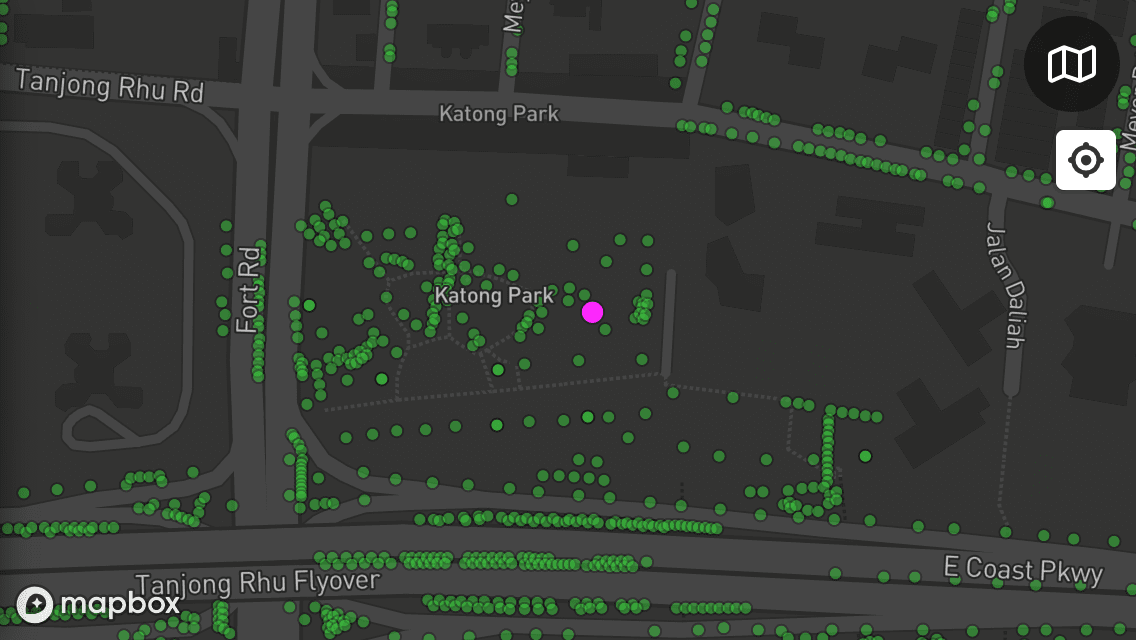
Amazingly, I also found a tree in Katong Park that's both a heritage tree and flowering at the same time! 🤯 (Color-coded as pink)
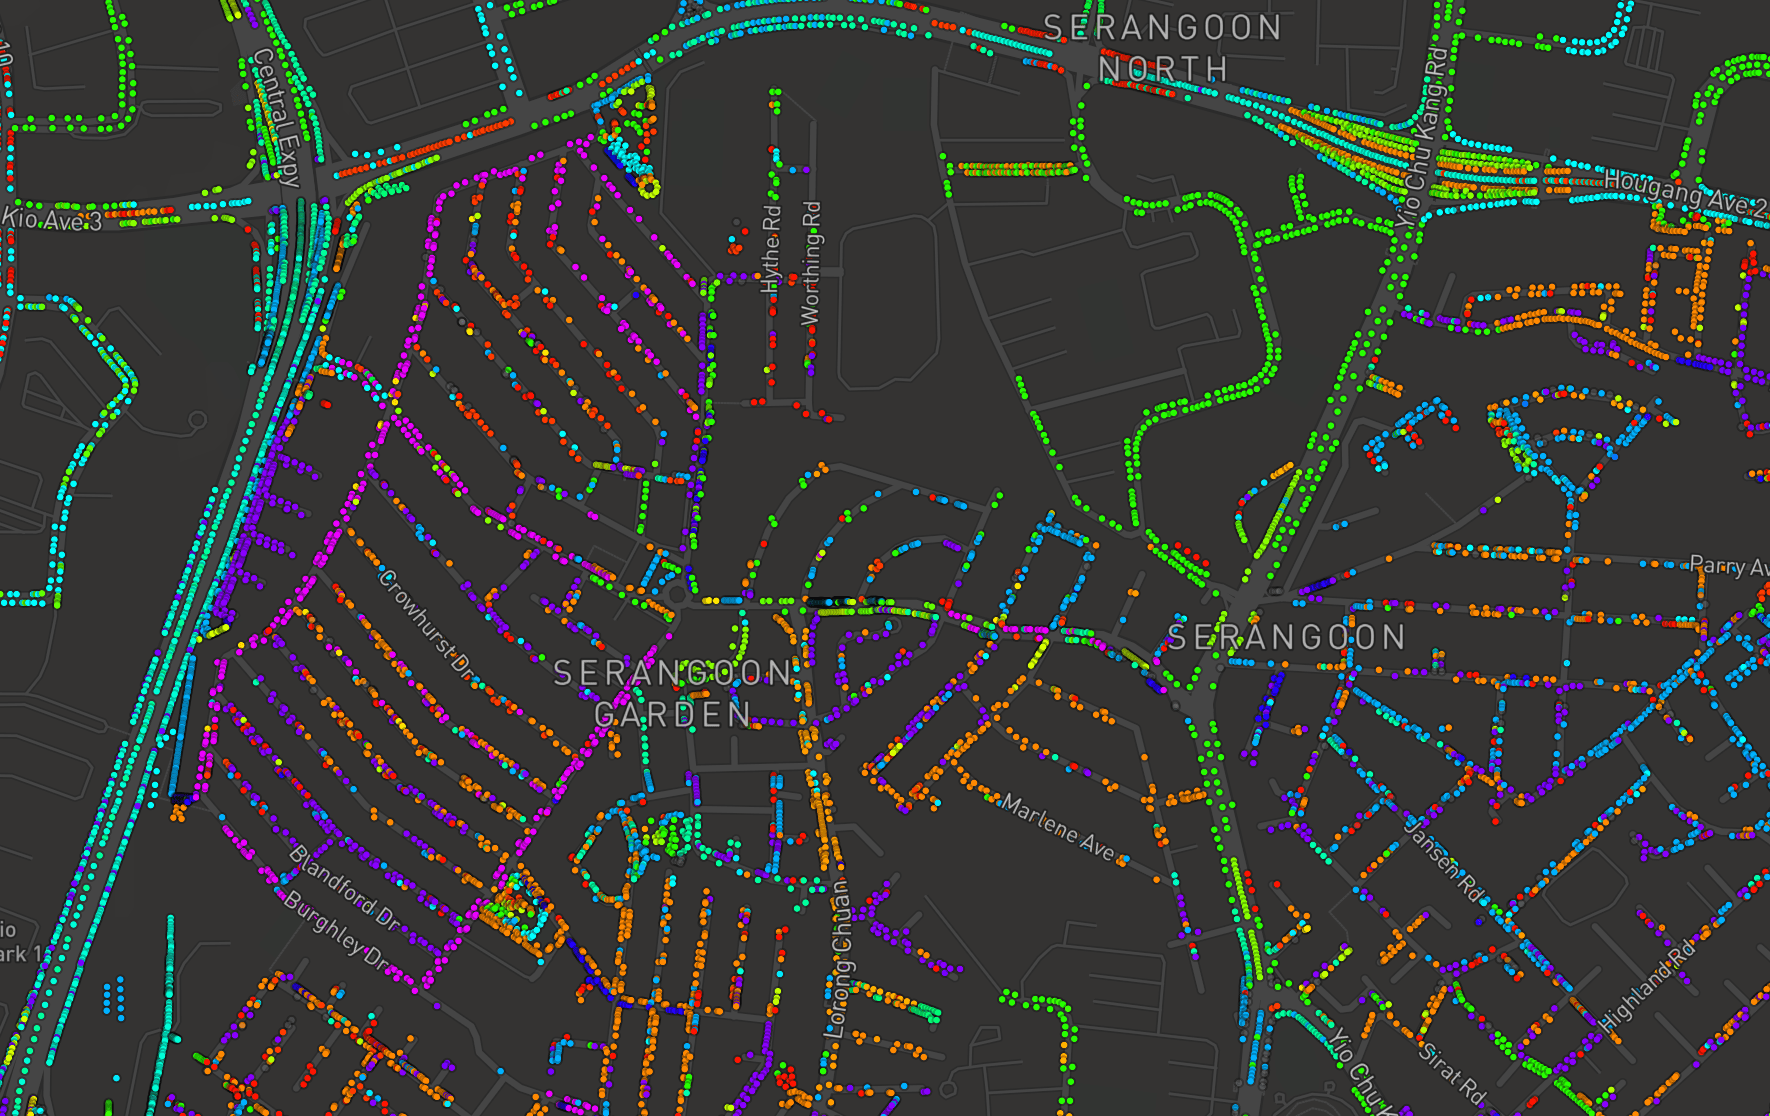
I'm so excited to see that it works that I also applied the same visual treatment for styling the trees based on girth width… (yellow for thinnest, red for widest)
…and tree age. (yellow, green and red for less than 50 years, pink for 100 years and above)
Not all trees have girth and age information, so they are sort of grayed out.
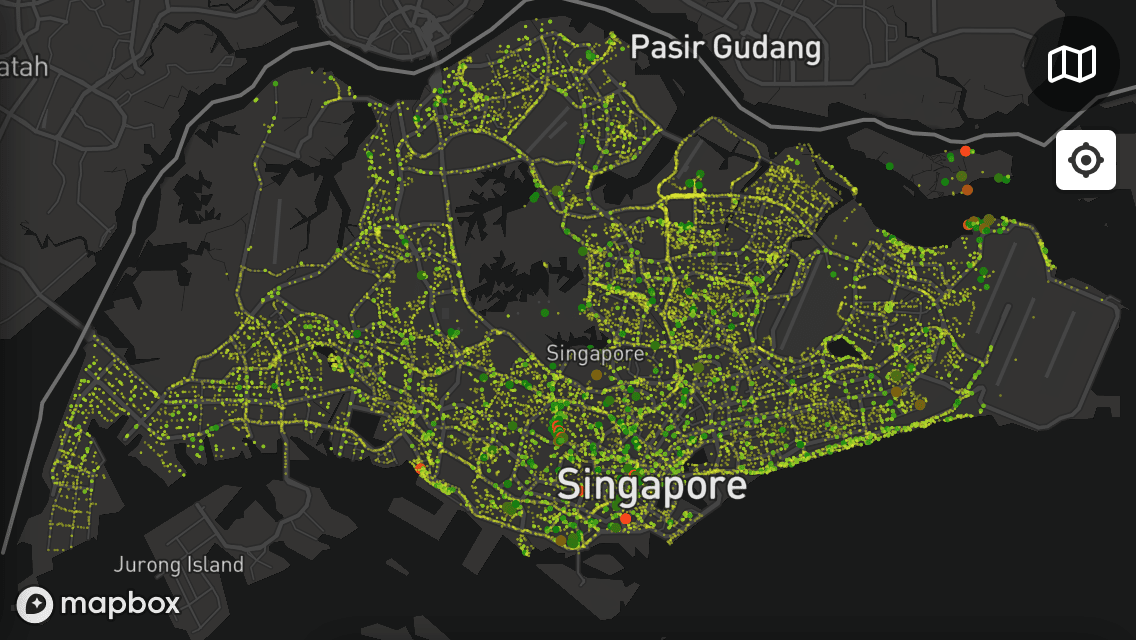
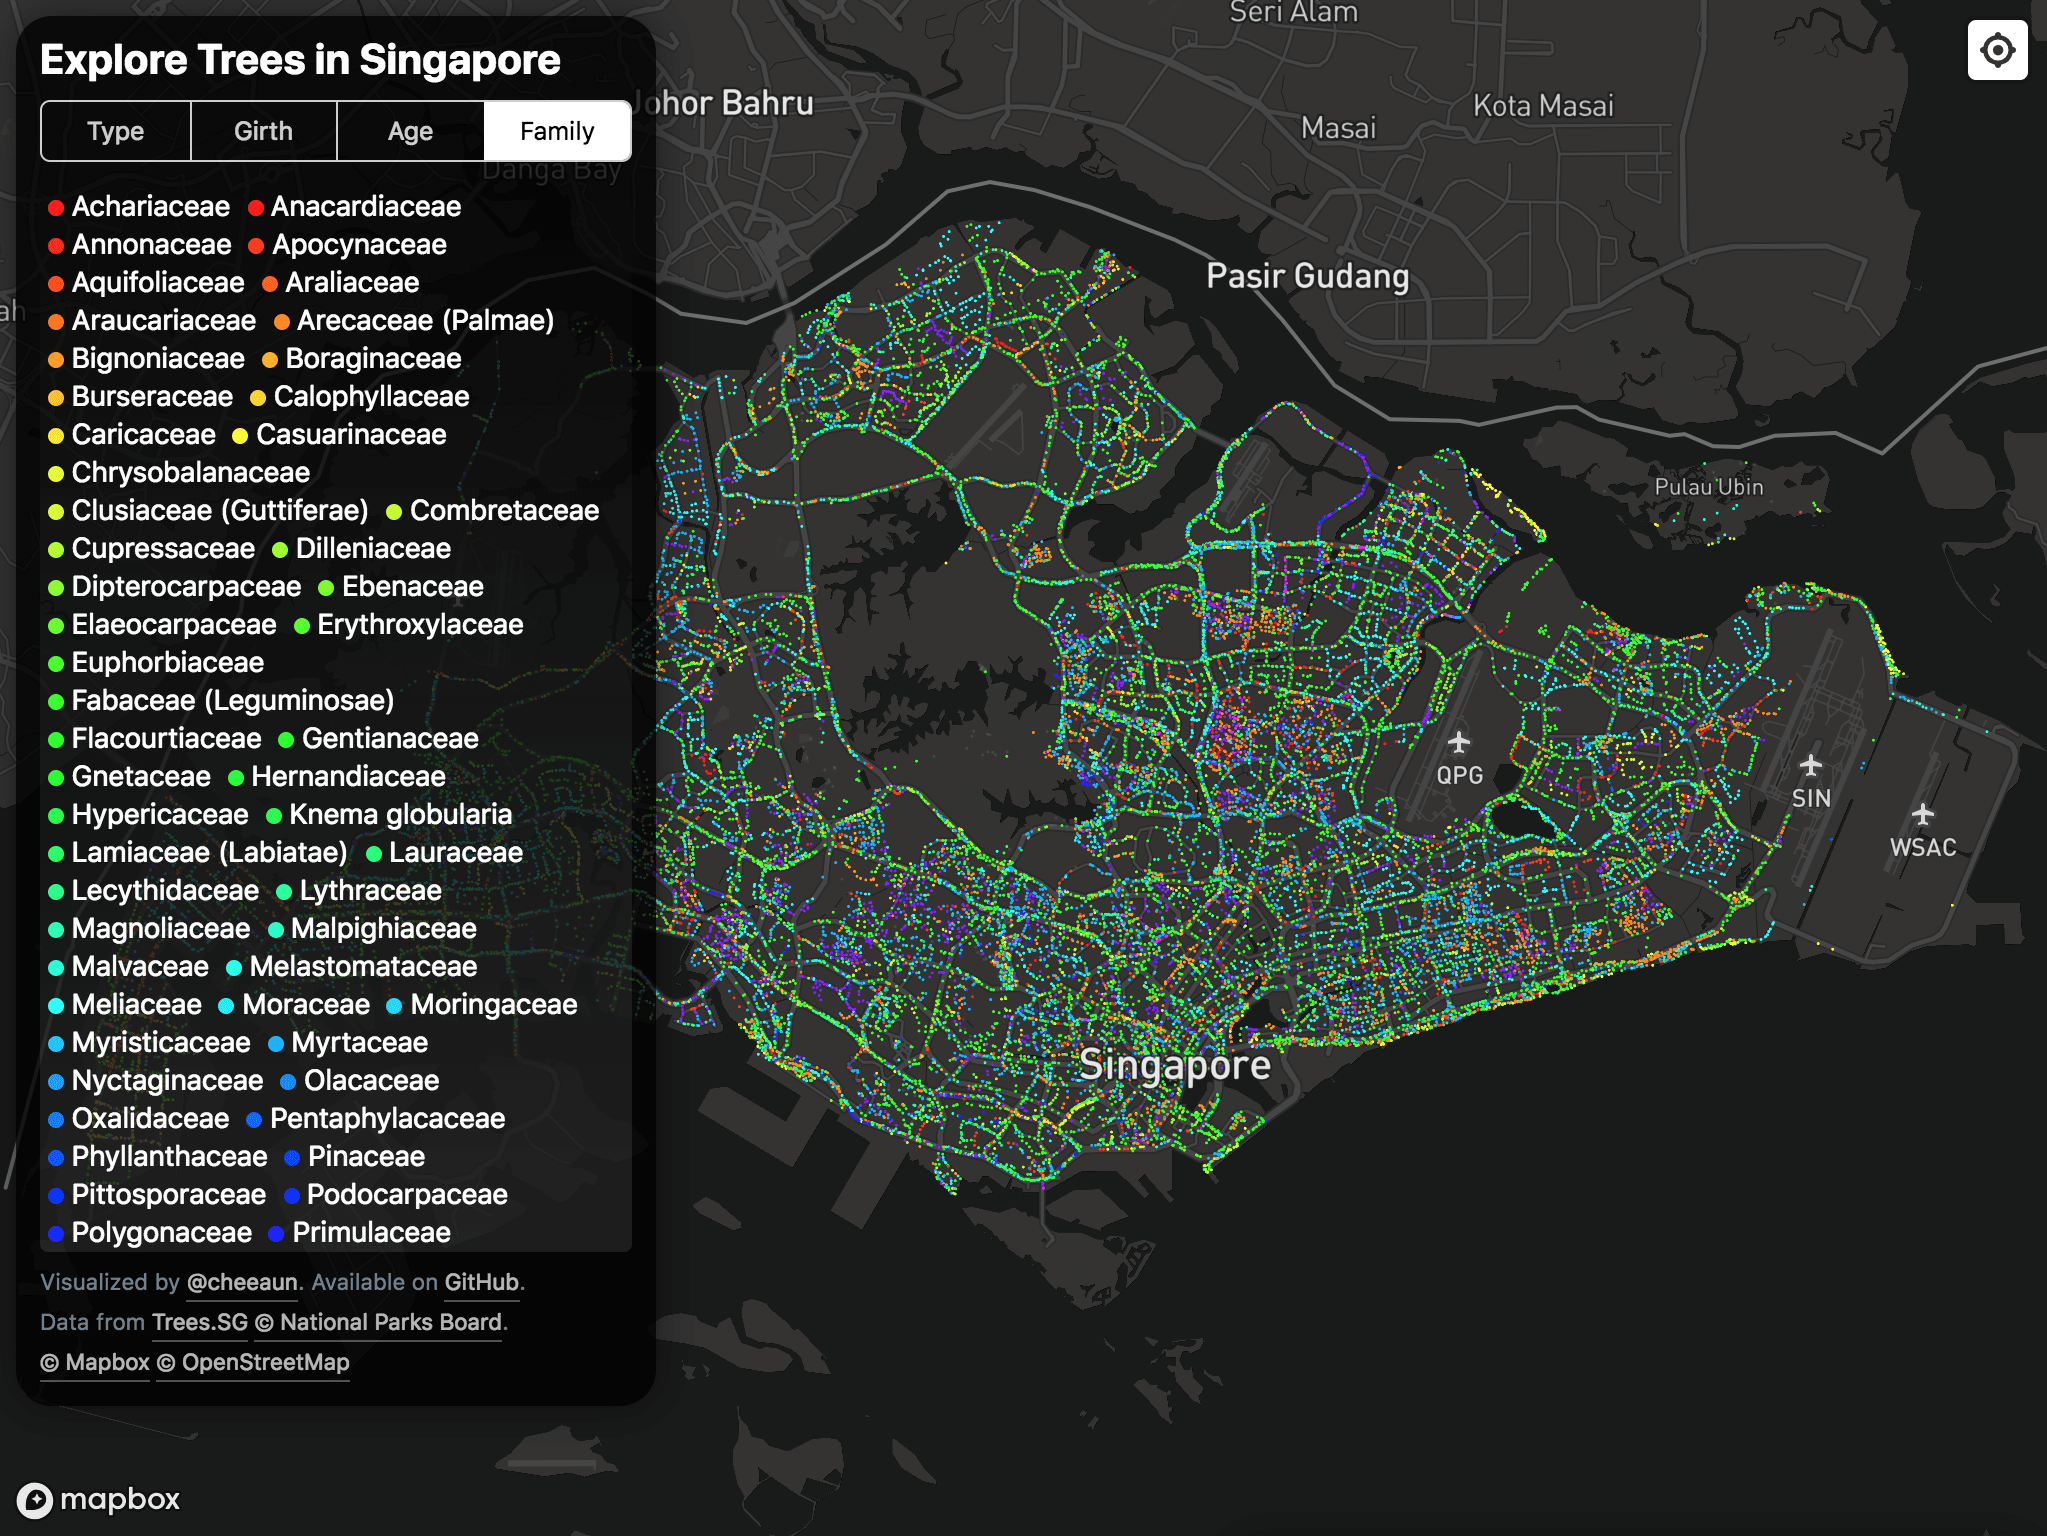
There is one more thing that I wanted to visualize: the tree species. I checked the data and found 1,709 species in total. Color-coding such large amount of data points would be quite gibberish in my opinion, so I decided to group them up and visualize the tree families instead.
Surprisingly the data that I fetched from Trees.sg doesn't have the tree family information, but on the site, it contains that information. 🤔
A little detective work reveals that it's from yet another (POST) API call:
https://www1.nparks.gov.sg/ptmapi/TreeInformationApi/GetTreeInformation
Again, I sprinkled my scripting magic to fetch all tree families, construct a list of species-to-family mappings, reinforce the tree family information to the GeoJSON files, regenerate the vector tiles, and reupload them again to Mapbox Studio.
Feast your eyes on this map of 65 tree families in its full rainbow glory. 🤩😍🌈
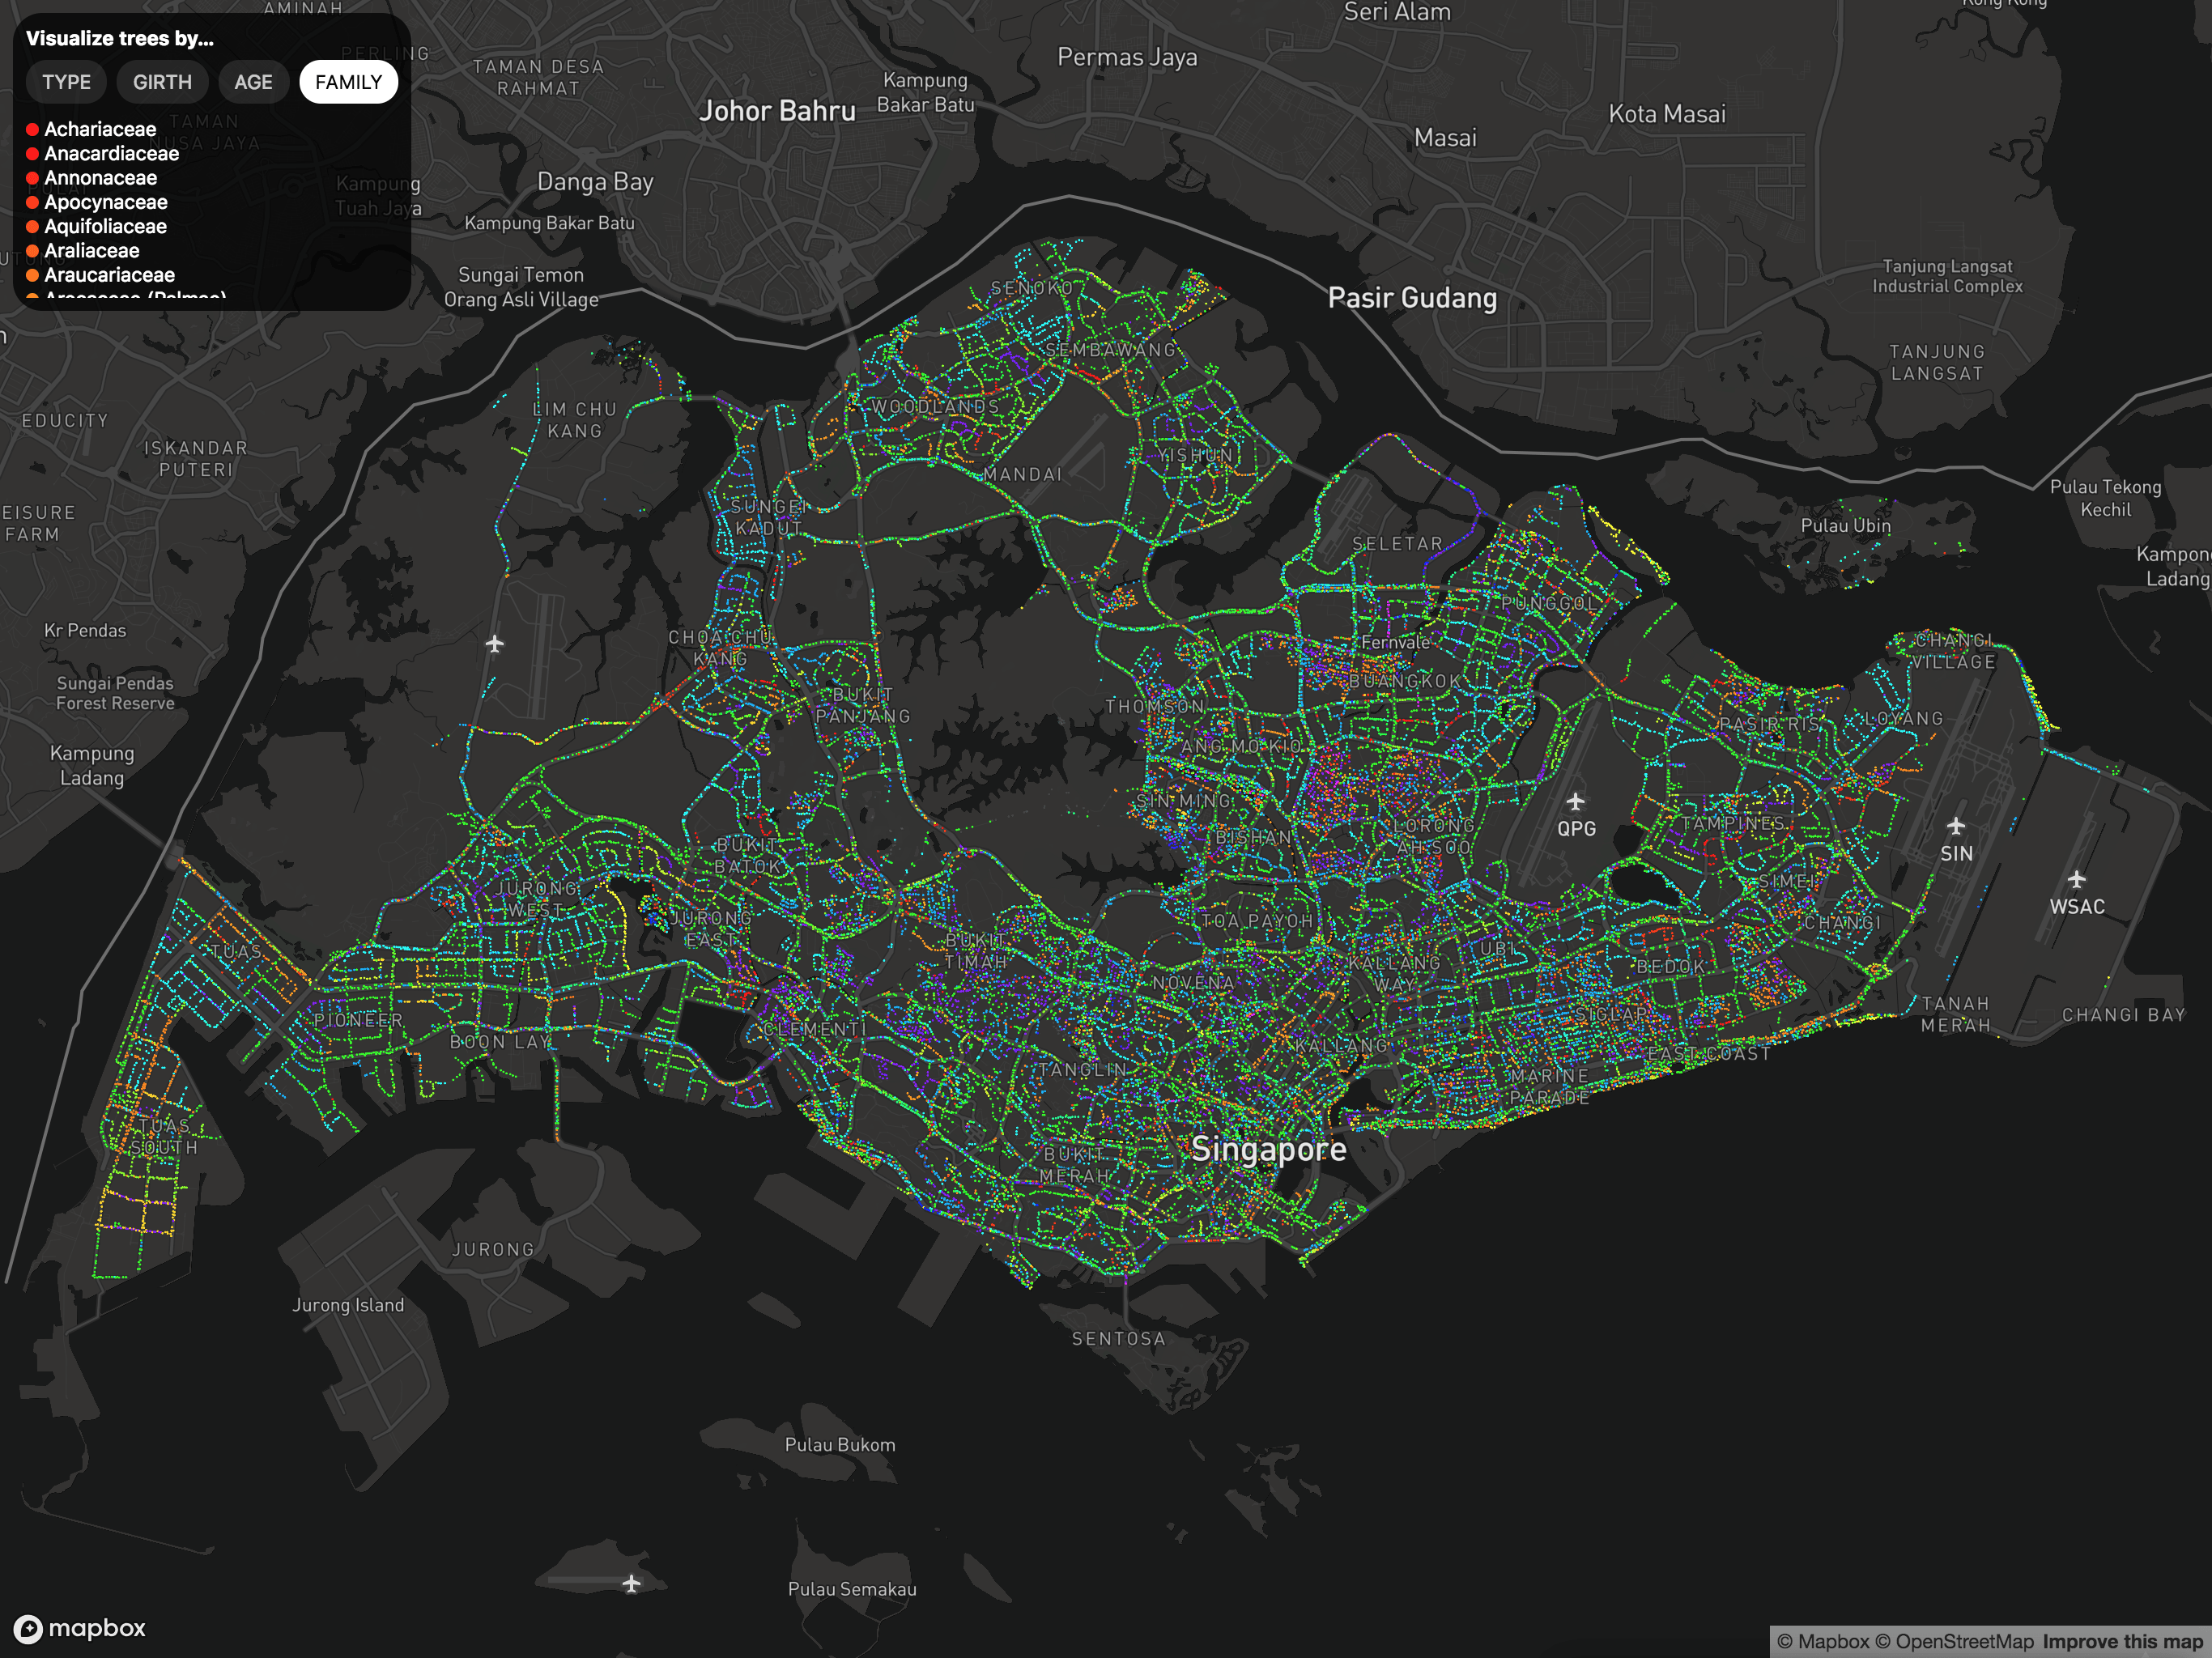
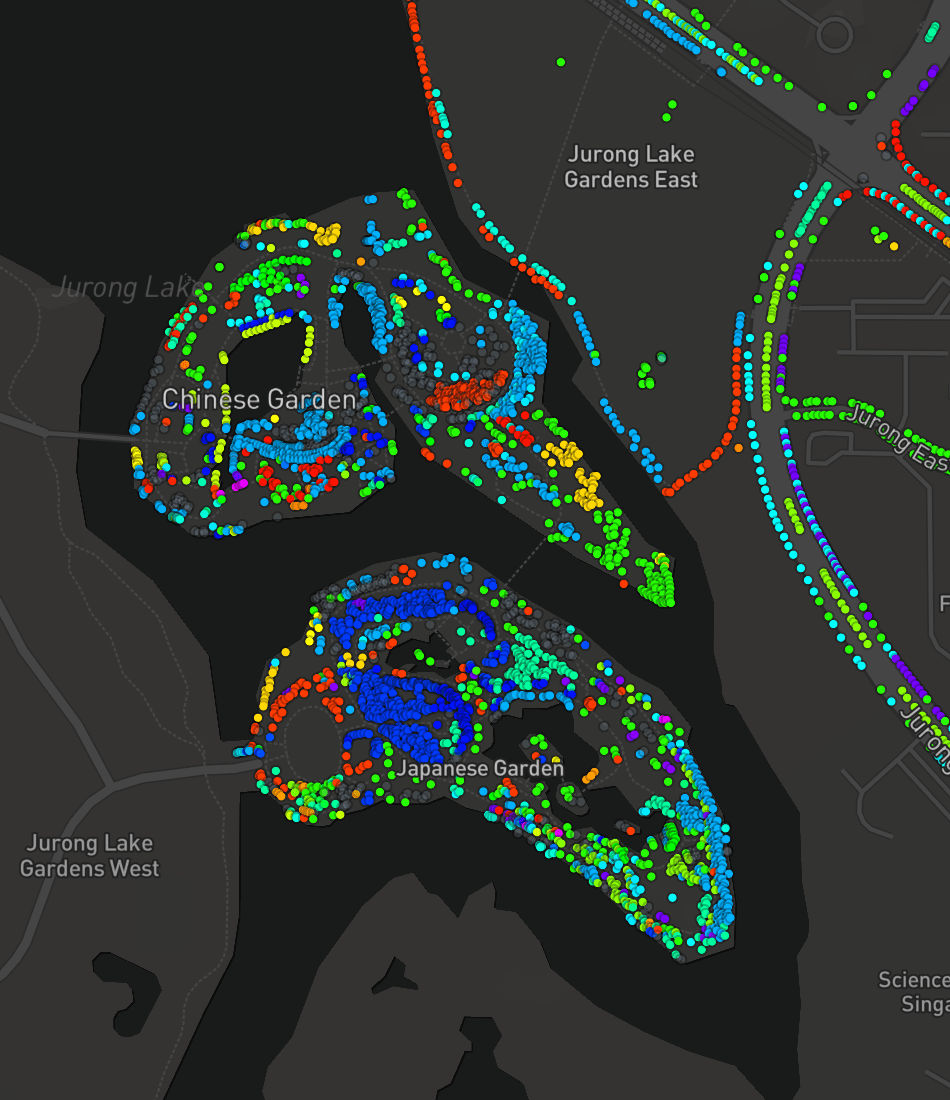
Obviously the color range is not 100% perfect because I did a simplistic hue rotation from 0 to 300 (not 360), and apply them with HSL color space.
I'm not particularly knowledgeable in choosing colors for data visualization so I did a little research and found Mike Bostock's A Less-Angry Rainbow. I learned that HCL contains a more constant luminance than HSL, and Cubehelix rainbow extends that further while looking prettier 💅. These color spaces are also part of d3-color, which helps a lot for me to try them out.
The next few hours after that, I was drowning in the psychedelic world of colors and research papers of data visualizations on the Internet 😵. I manage to pull myself back to reality and simply stick to HSL since it's easier to manipulate with CSS and on Mapbox GL JS. Mapbox GL JS does support RGB, Lab and HCL color spaces but there doesn't seem to have any examples on how to use them and it's not yet supported on non-JS platforms. 🤔
Designing the User Interface
While tinkering with the data, I iterated and evolved the UI quite a few times.
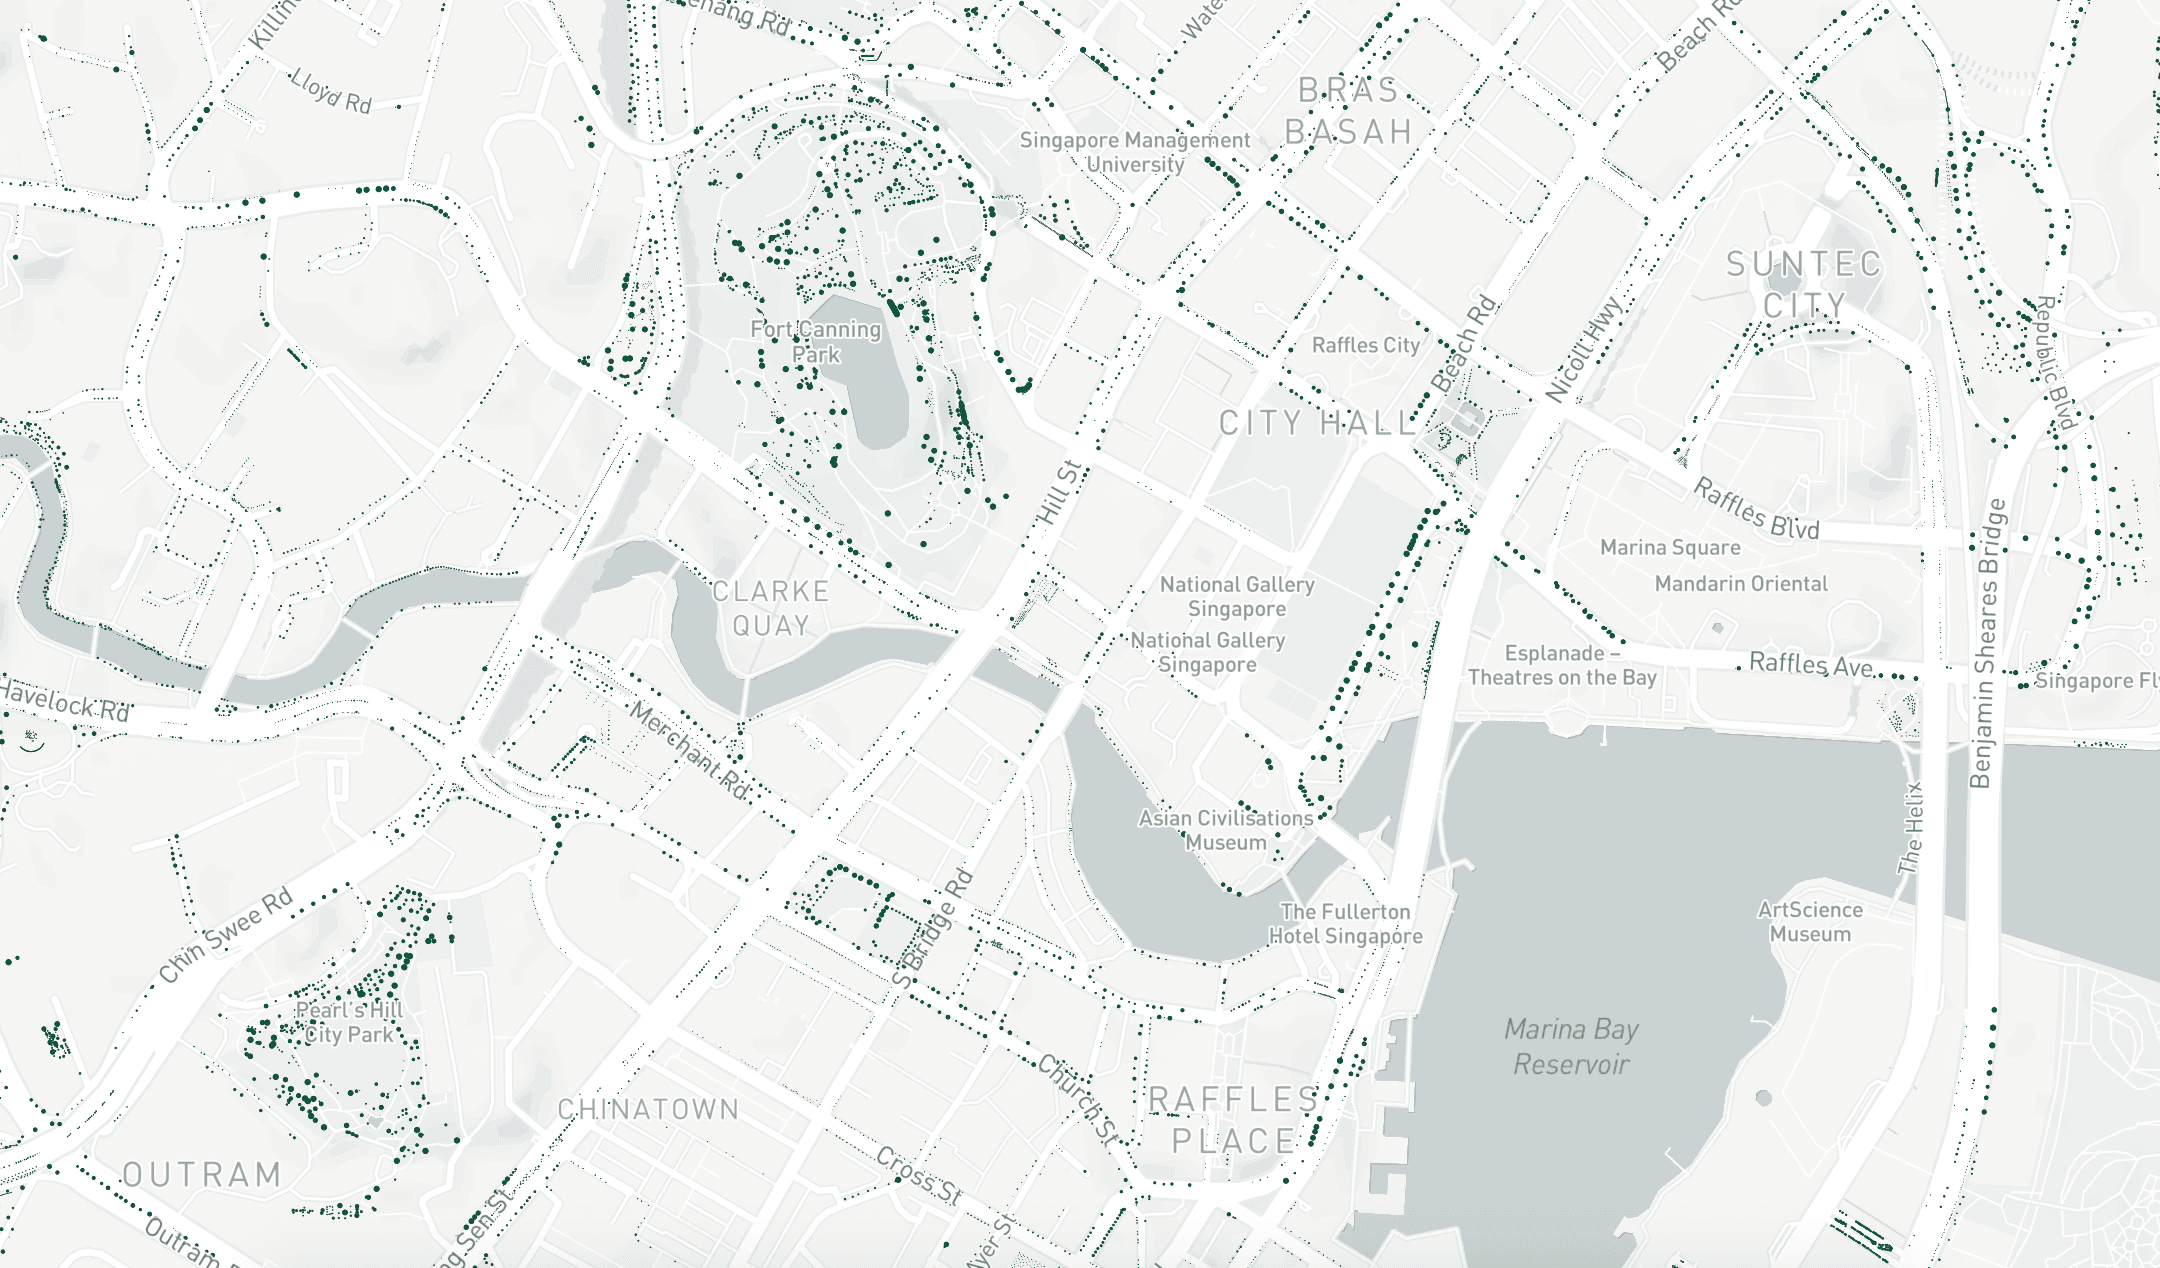
From the default 'Street' tiles in Mapbox GL JS, I changed it to 'Light' tiles to match Trees.sg, and finally settled with 'Dark' tiles so that the data points would stand out.
My main goal for this project is to make it super easy to explore trees, which leads to these requirements:
- Super-quick information popovers when hovering over the data points. Unlike Trees.sg, it won't have any clusters so that users don't need to keep zooming in until they see individual trees. It has to be super-quick because I personally don't have the patience to click on the trees one-by-one to see more information 😅 (Remember, there are 500,000 of them).
- Quick scanning of data points. On lower zoom levels, users would be able to quickly scan within seconds for the heritage trees, flowering trees, oldest trees, trees with the widest girth, or specific tree families. This goal has already been achieved by my initial attempts.
- Geolocation feature for users to find trees around their current location. Since this feature is more common among mobile phone users, the web app has to be mobile-optimized. Trees.sg has this feature too.
For the informations popovers, it'll only work on devices supporting mouse hovers. For touch devices, users will still have to tap on them. 😢
There are 4 layers of visualization; tree type, girth size, age and family. They are shown in the Layers panel, hidden by default on smaller screen sizes and can be shown by clicking on the 'map' icon at the top right.
The UI for the Layers panel is mostly inspired by Apple Maps' Settings popover.
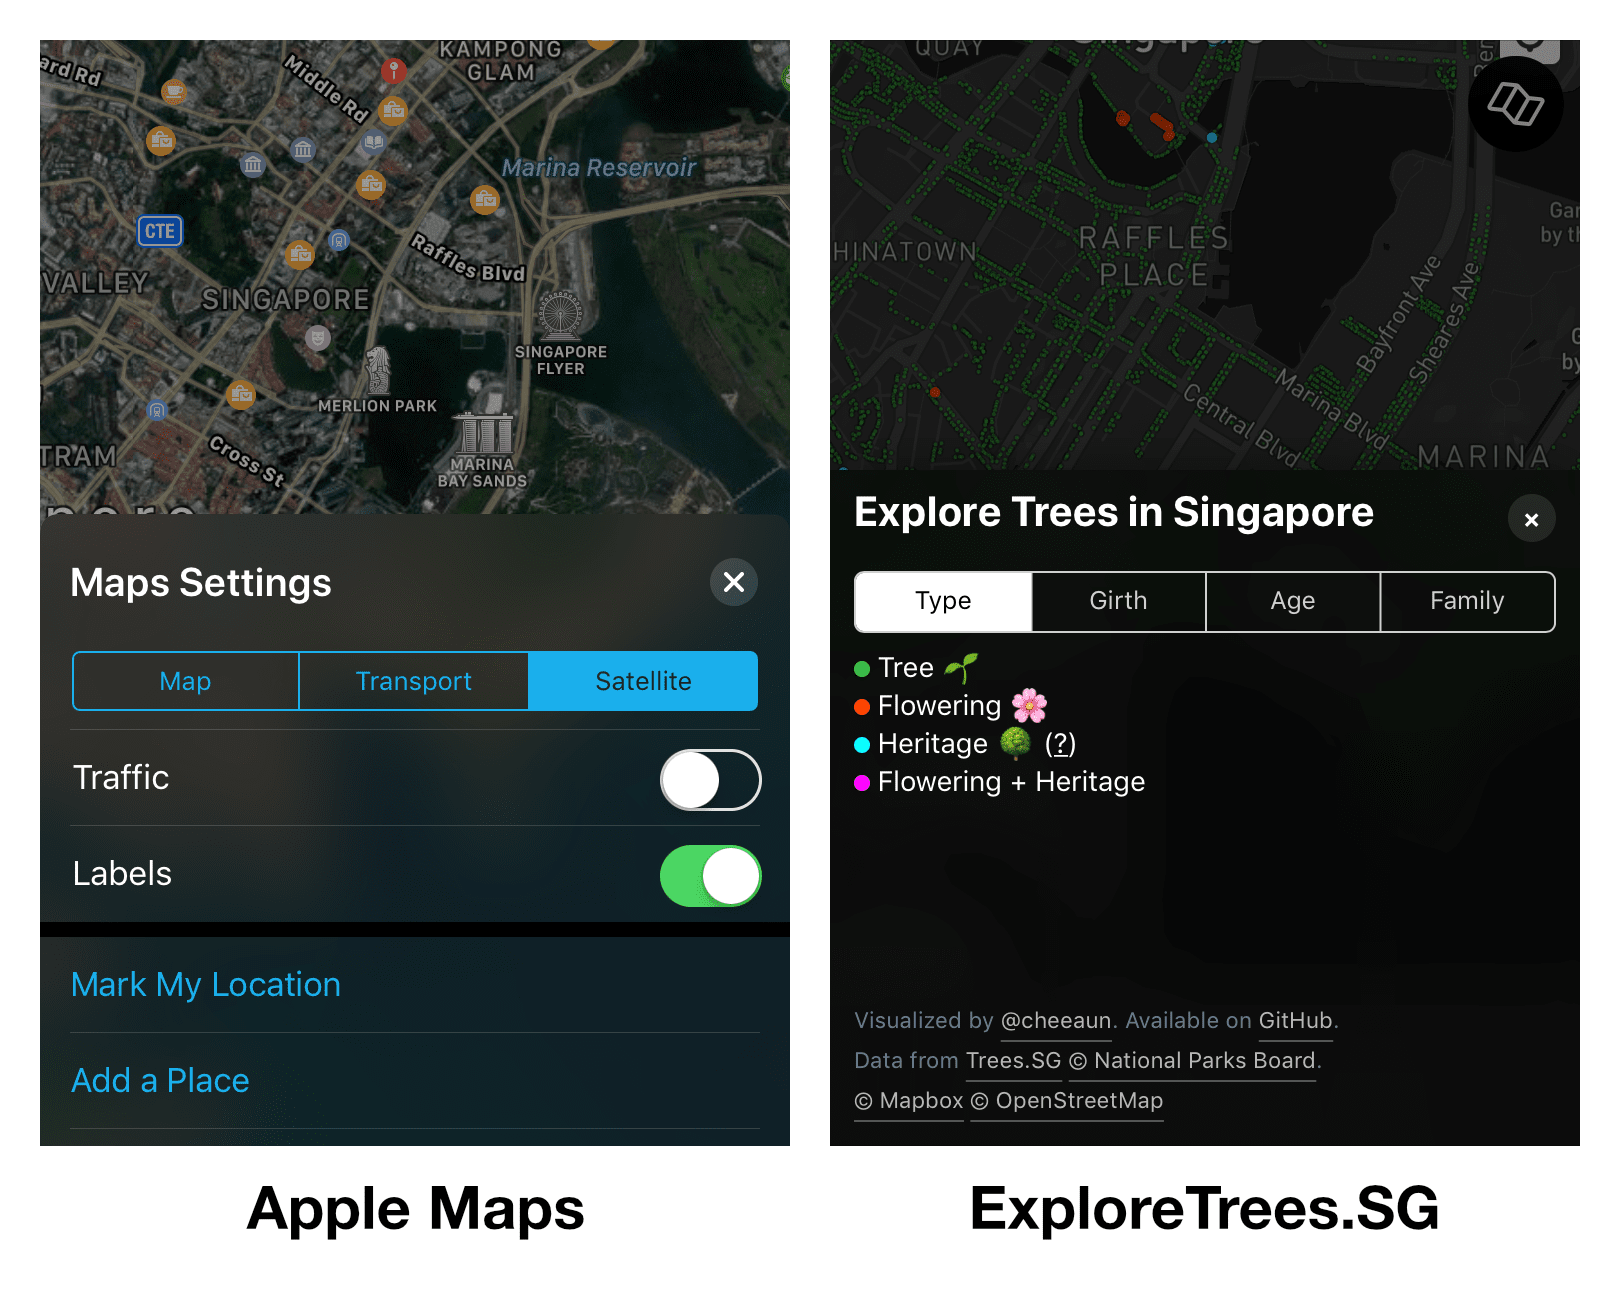
The Layers panel also includes relevant information and legends for the data points. For example, when the 'Family' layer is selected, it'll show legend for all tree families. As the screen size is larger, the Layers panel will be shown at the top left by default.
On Trees.sg, when the map is zoomed in to a higher level, it will switch to the satellite view from Google Maps. I think it make sense as people could map the plotted trees to the real trees on actual satellite images.
Despite that, it can be quite blurry and sometimes don't work too well…
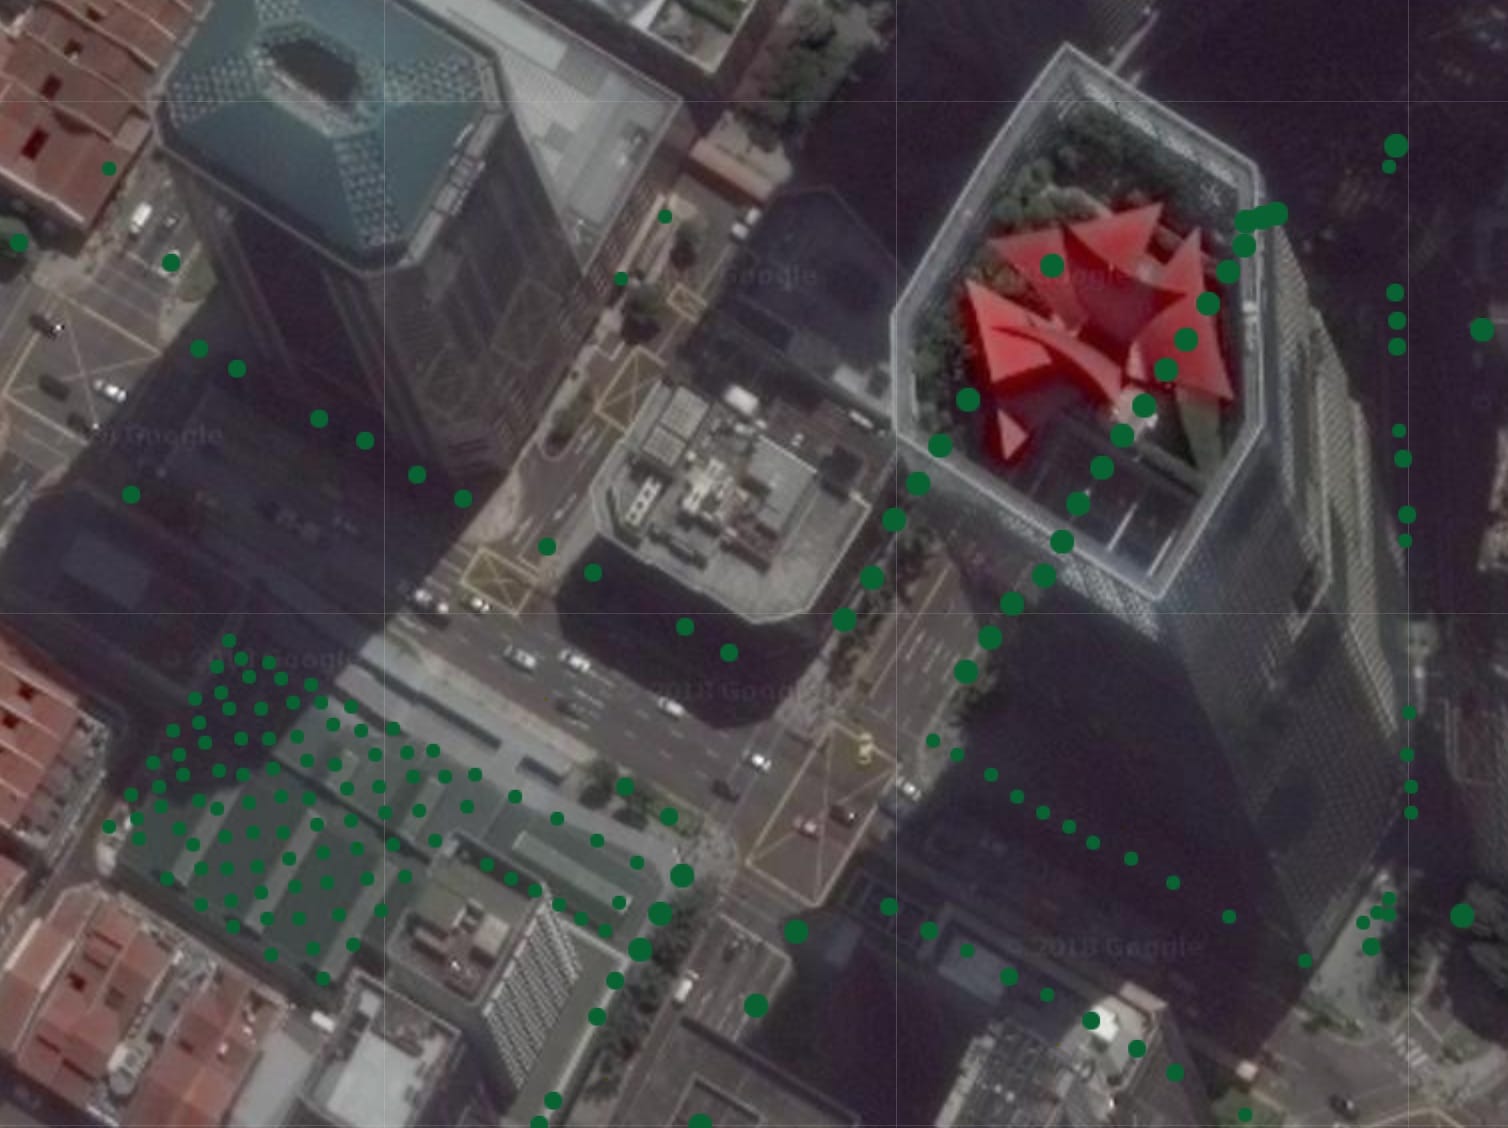
I thought Mapbox's satellite tiles could be better but boy was I wrong 😅

I agree that it's a logical idea, but ideally speaking, it doesn't work well as the satellite images can be a bit messy and congested with too much information. If the satellite images are outdated, some of the recorded trees might be plotted on newly developed or demolished sites.
I decided to show the satellite image inside the information popover instead.
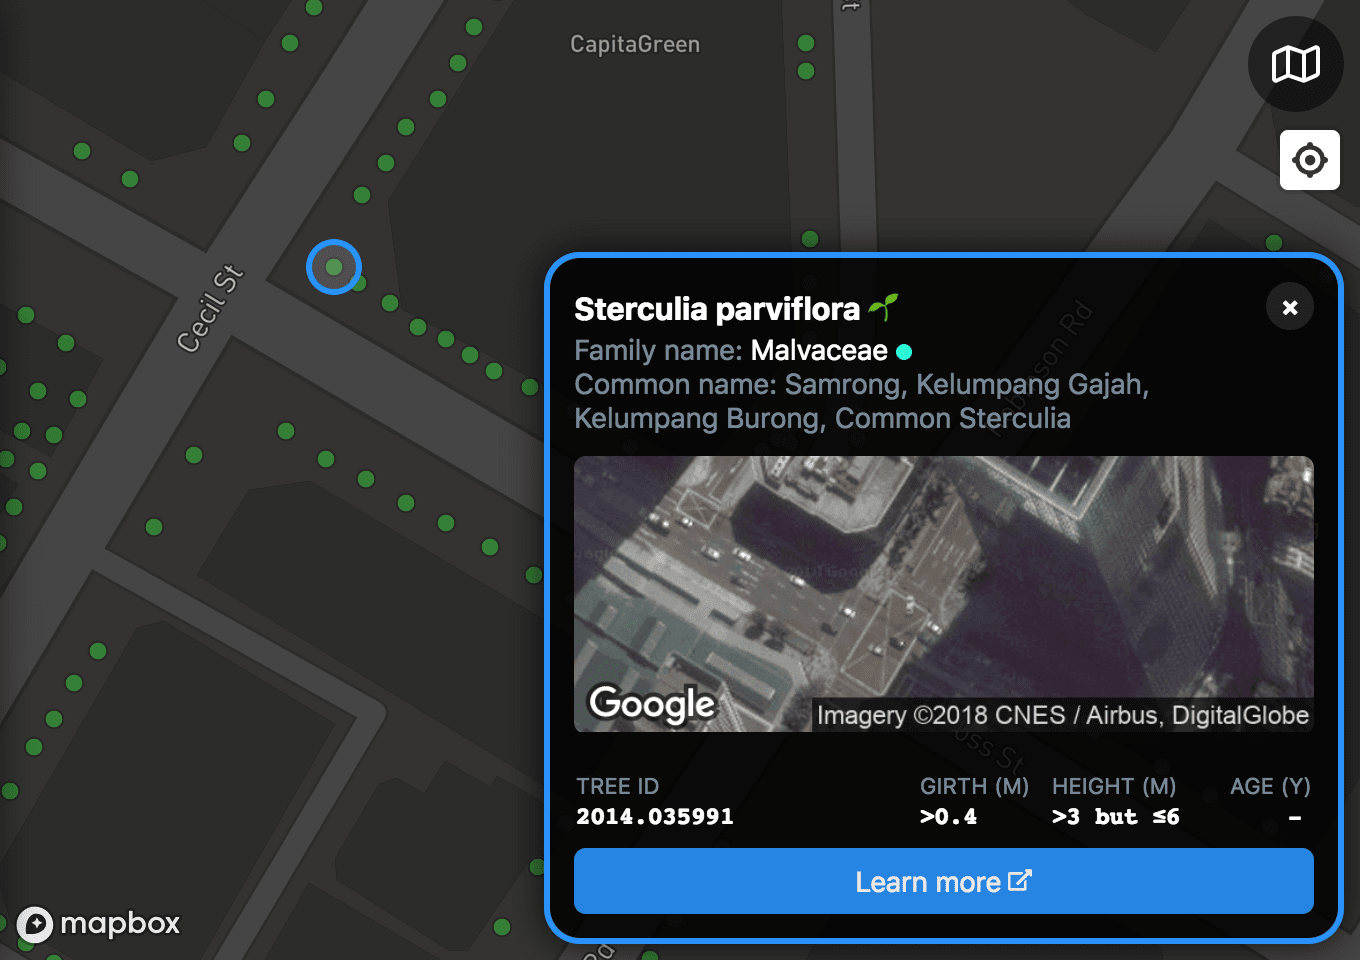
The information popover also includes a 'Learn more' link to NParks Flora & Fauna Web (warning, very slow site), for each individual tree species, for example this page on Sterculia parviflora Roxb.
Unlike Trees.sg, ExploreTrees.sg doesn't have these features:
- Location and species search
- Layers for tree conservation areas and heritage roads
- Additional information like tree benefits and pruning date
- Photo uploading for flowering trees
- Hugs (Facebook Like 👍, for trees)
- Treemail (Send a post, message or photo to specific trees)
I'm not sure if I'll implement them soon but so far, I think it's good for now for ExploreTrees.SG (MVP?).
Honestly, I never even thought of creating a web app out of this in the first place, as my initial intention was just to visualize the data for fun. 😝
Launching ExploreTrees.SG
Ever since the day I posted about my attempt to scrape the data, it's been retweeted and liked a few times, especially this tweet by @ruanyf. Even @OpenDataTaylorSwift retweeted it, twice! 😂 #achievementunlocked

On 27 March, I showed a sneak peek.
On 2 April, I launched ExploreTrees.SG to the public 🚀.
Some folks might be wondering why I don't call it 'treerouter.sg'. Firstly, I've built 3 web apps with the word 'router' prepended; busrouter, railrouter and taxirouter. Though it has become sort of a brand for me, I'm kind of bored of it and perhaps wanted to reserve it for transportation-specific purposes. Trees.sg domain is already taken (seriously good domain in my opinion), so I thought why not append a verb to it, and voilà, ExploreTrees.SG 😂.
Feedback has been good and moderate so far. Obviously I wouldn't want my project to take the attention away from Trees.sg since I believe that those guys have done way more work than I do.
In fact, during the few days of building this project, a few people have indirectly helped me along the way. Steve Bennett have built a similar project called OpenTrees.org. Hannah Yan referred me to other projects like Treepedia by MIT Senseable City Lab: Singapore and An Interactive Visualization of NYC Street Trees. My further research reveals even more projects that are quite similar and I've listed most of them in my project's README.
I still find it quite unbelievable that all these happened in just two weeks. From a tiny curiosity, leads to a super cool full-fledged interactive data visualization web app.
I've learnt so much and open-sourced everything on GitHub. I really hope that this will help others to learn more, as much as it helps me. 😊
Happy tree exploring. 🌳🚶♂️🚶♀️